Elkhart: Fire Incidents, Kansas (KS)
Where are fire incidents reported in Elkhart, KS
Something went wrong! Please refresh the page.
|
| |||||||||||||||||||||||||||||||||||||||||||||||||||||||||||||||||||||||||||||||||||||||||||||||||||||||||||||
| Other | 37 | |||||||||||||||||||||||||||||||||||||||||||||||||||||||||||||||||||||||||||||||||||||||||||||||||||||||||||||
2002 - 2018 National Fire Incident Reporting System (NFIRS) incidents
- Incident types reported to NFIRS in Elkhart, KS
- 17172.5%Fire
- 2811.9%Rescue & EMS
- 208.5%Good Intent Call
- 125.1%Hazardous Condition
- 20.8%False Alarm
- 20.8%Severe Weather
- 10.4%Service Call
- Fire incident types reported to NFIRS in Elkhart, KS
- 10561.4%Outside Fires
- 3520.5%Structure Fires
- 2414.0%Mobile Property/Vehicle Fires
- 74.1%Other
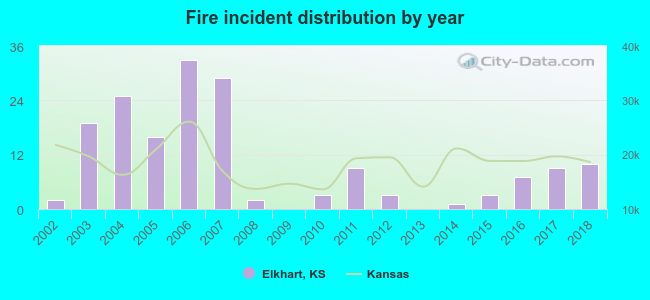 Based on the data from the years 2002 - 2018 the average number of fire incidents per year is 10. The highest number of fires - 33 took place in 2006, and the least - 0 in 2009. The data has a growing trend.
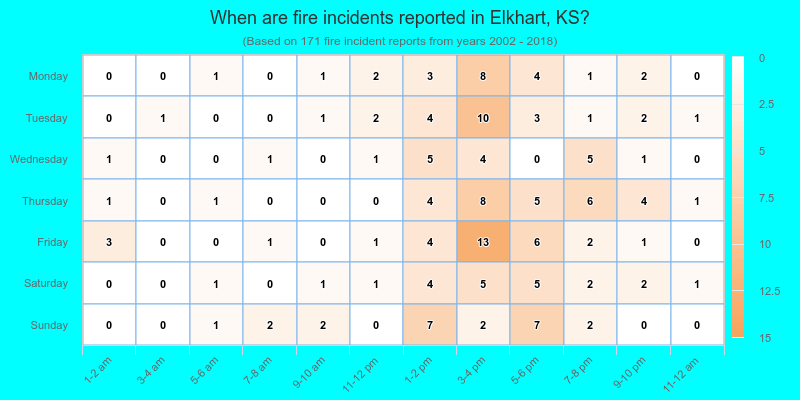
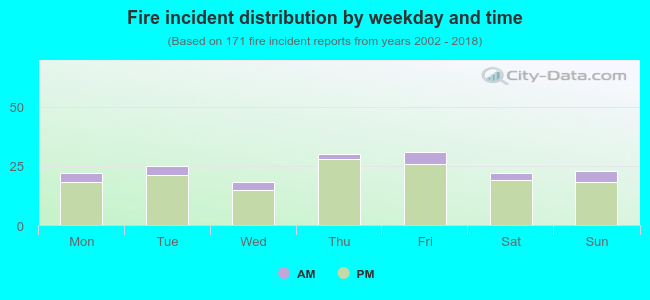 15.2% incidents where reported in the morning and 84.8% in the evening. The most fires (18.1%) took place on Friday, and the least (10.5%) on Wednesday.
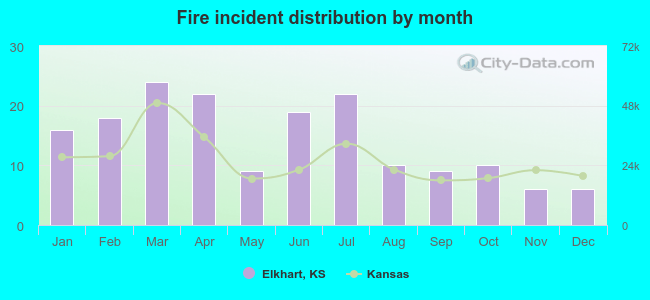 According to the 171 fire incidents from years 2002 - 2018 most fires (14.0%) took place during March, and the least (3.5%) in November.
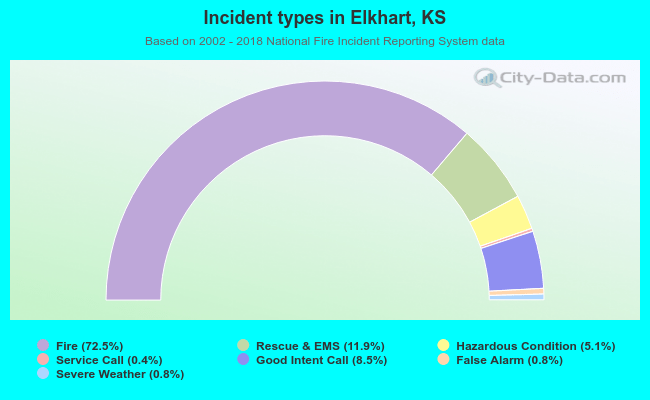 Out of all 236 cases reported during the years 2002 - 2018, the most belonged to the categories: Fire (72.5%), Overpressure Rupture (11.9%), and Service Call (8.5%).
 When looking into fire subcategories, the most incidents belonged to: Outside Fires (61.4%), and Structure Fires (20.5%).