Elmont: Fire Incidents, New York (NY)
Where are fire incidents reported in Elmont, NY
Something went wrong! Please refresh the page.
|
| |||||||||||||||||||||||||||||||||||||||||||||||||||||||||||||||||||||||||||||||||||||||||||||||||||||||||||||
2003 - 2018 National Fire Incident Reporting System (NFIRS) incidents
- Incident types reported to NFIRS in Elmont, NY
- 2,26251.4%Rescue & EMS
- 86119.6%Fire
- 54212.3%Hazardous Condition
- 3427.8%Service Call
- 3177.2%False Alarm
- 641.5%Good Intent Call
- 80.2%Overpressure Rupture
- Fire incident types reported to NFIRS in Elmont, NY
- 54363.1%Other
- 28232.8%Structure Fires
- 333.8%Outside Fires
- 30.3%Mobile Property/Vehicle Fires
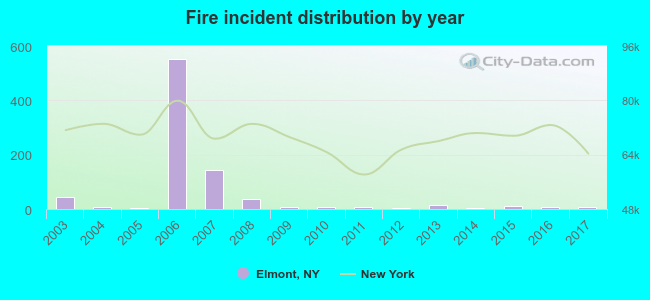 Based on the data from the years 2003 - 2018 the average number of fire incidents per year is 57. The highest number of fires - 553 took place in 2006, and the least - 2 in 2005. The data has a dropping trend.
The average number of yearly fire incidents per 10k residents in Elmont, NY compared to nearest cities:
(Note: Based on data for the last 3 years, including only cities with population 5,000 and above)
| Elmont: | 2.1 |
| Franklin Square: | 5.1 |
| Floral Park: | 13.2 |
| New Hyde Park: | 20.8 |
| Malverne: | 6.2 |
| Valley Stream: | 12.8 |
| West Hempstead: | 19.8 |
| Lakeview: | 6.5 |
| North New Hyde Park: | 6.4 |
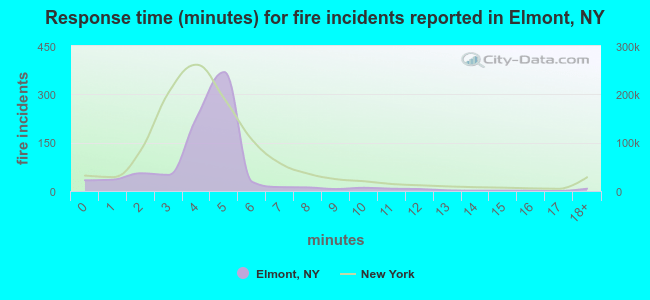 The median response time based on all reported fire incidents is 5 minutes. This is higher than the state median value.
The median response time in Elmont, NY compared to nearest cities:
(Note: Based on data for all years, including only cities with at least 500 fire incidents)
| Elmont: | 5 minutes |
| Franklin Square: | 4 minutes |
| Floral Park: | 2 minutes |
| New Hyde Park: | 4 minutes |
| Valley Stream: | 4 minutes |
| West Hempstead: | 0 minutes |
| Garden City: | 3 minutes |
| Lynbrook: | 3 minutes |
| Hempstead: | 3 minutes |
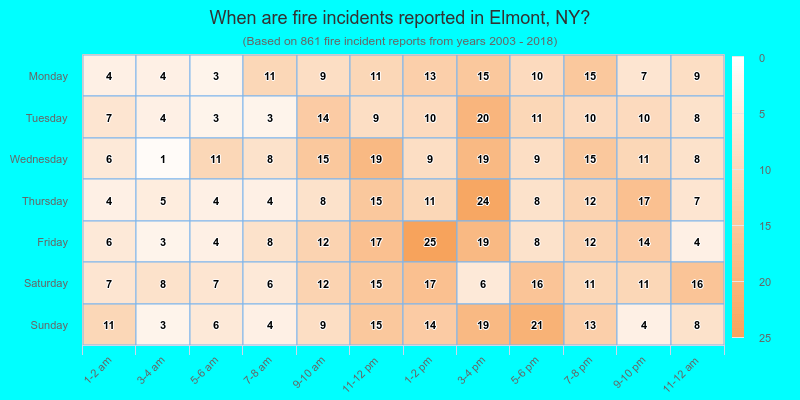
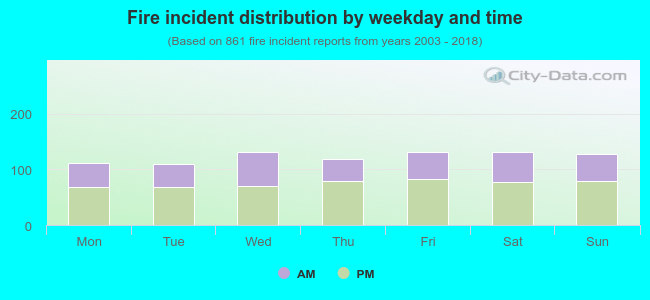 38.9% incidents where reported in the morning and 61.1% in the evening. The most fires (15.3%) took place on Friday, and the least (12.7%) on Tuesday.
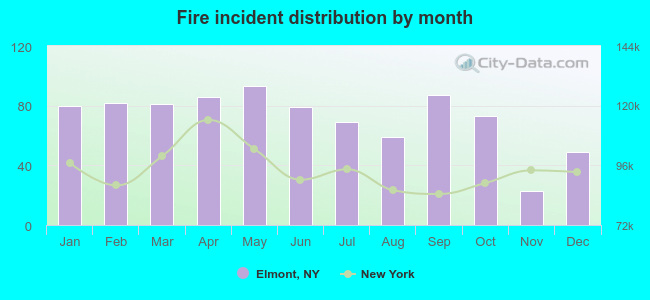 Based on the 861 reports from years 2003 - 2018 most fires (10.8%) took place during May, and the least (2.7%) in November.
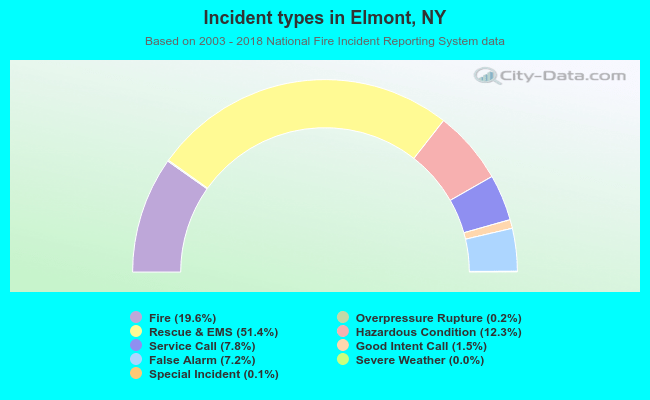 Out of all 4,400 cases reported during the years 2003 - 2018, the most belonged to the categories: Rescue & EMS (51.4%), Fire (19.6%), and Hazardous Condition (12.3%).
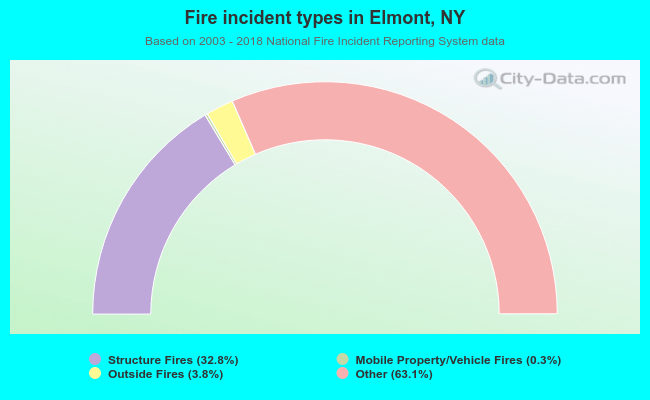 When looking into fire subcategories, the most incidents belonged to: Other (63.1%), and Structure Fires (32.8%).