Essex: Fire Incidents, Connecticut (CT)
Where are fire incidents reported in Essex, CT
Something went wrong! Please refresh the page.
|
| |||||||||||||||||||||||||||||||||||||||||||||||||||||||||||||||||||||||||||||||||||||||||||||||||||||||||||||
2002 - 2018 National Fire Incident Reporting System (NFIRS) incidents
- Incident types reported to NFIRS in Essex, CT
- 46237.7%Rescue & EMS
- 22718.5%Hazardous Condition
- 20416.6%False Alarm
- 15812.9%Fire
- 1109.0%Service Call
- 574.6%Good Intent Call
- 40.3%Overpressure Rupture
- 40.3%Special Incident
- Fire incident types reported to NFIRS in Essex, CT
- 7950.0%Structure Fires
- 4327.2%Outside Fires
- 2012.7%Mobile Property/Vehicle Fires
- 1610.1%Other
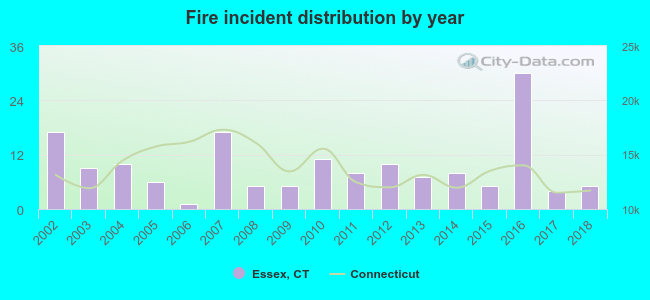 According to the data from the years 2002 - 2018 the average number of fire incidents per year is 9. The highest number of fires - 30 took place in 2016, and the least - 1 in 2006. The data has a dropping trend.
The average number of yearly fire incidents per 10k residents in Essex, CT compared to nearest cities:
(Note: Based on data for the last 3 years, including only cities with population 5,000 and above)
| Essex: | 19.5 |
| Old Saybrook: | 66.7 |
| Westbrook: | 32.7 |
| Old Lyme: | 9.2 |
| Killingworth: | 38.3 |
| East Haddam: | 25.2 |
| Haddam: | 19.6 |
| East Lyme: | 20.4 |
| Madison: | 37.0 |
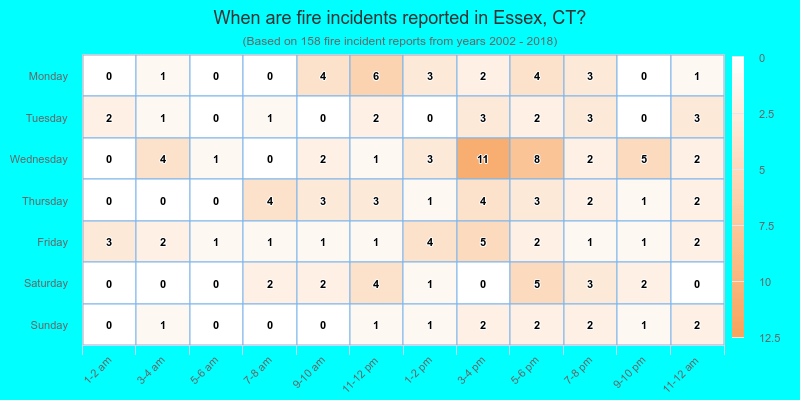
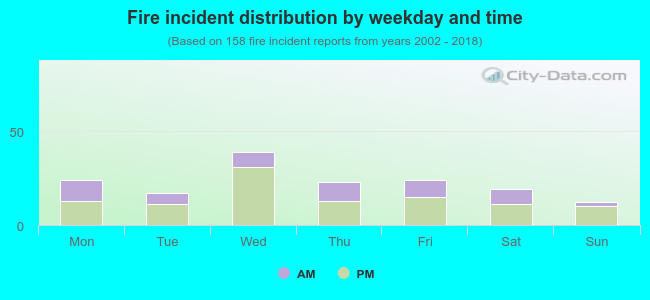 34.2% incidents where reported in the morning and 65.8% in the evening. The most fires (24.7%) took place on Wednesday, and the least (7.6%) on Sunday.
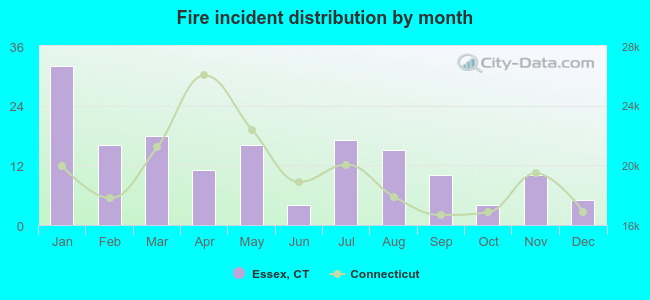 According to the 158 incident reports from years 2002 - 2018 most fires (20.3%) took place during January, and the least (2.5%) in June.
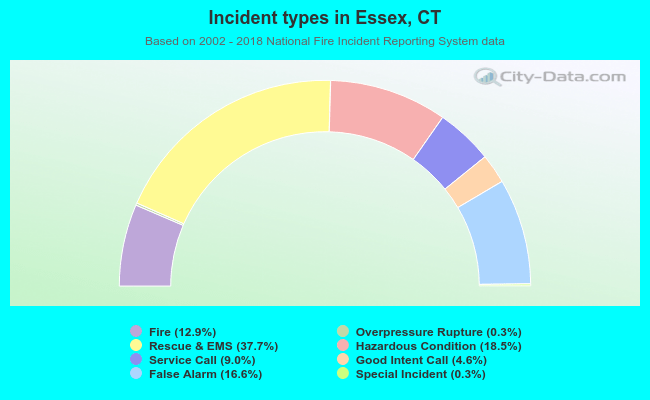 Out of all 1,226 cases reported during the years 2002 - 2018, the most belonged to the categories: Rescue & EMS (37.7%), Hazardous Condition (18.5%), and False Alarm (16.6%).
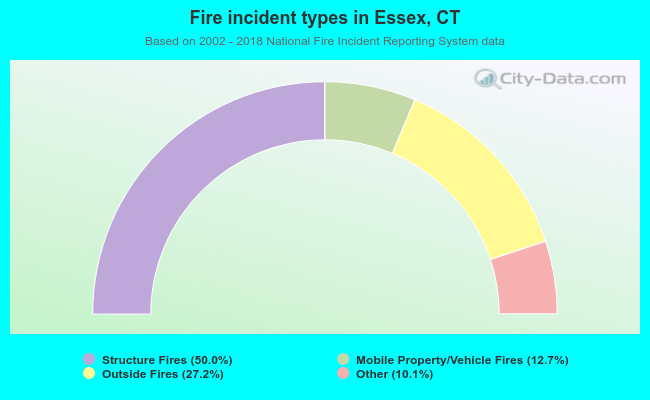 When looking into fire subcategories, the most reports belonged to: Structure Fires (50.0%), and Outside Fires (27.2%).