| Fire incidents reported |
|---|
| Sreet name | Count |
|---|
| CTY RD C | 8 | | CTY RD D | 6 | | HWY 53 | 6 | | BENJAMIN LN | 4 | | COUNTY ROAD D | 4 | | DOPP RD | 4 | | HWY 53 NORTH | 4 | | LUNDE COULEE RD | 4 | | MAIN ST | 4 | | MOEN COULEE RD | 4 | | ROGNESS COULEE RD | 4 | | WHALEN RD. | 4 | | 13314 WHALEN RD | 2 | | 13728 CTY C | 2 | | 15833 W. JUDD ST. | 2 | | 16984 DOPP RD | 2 | | 17792 HELSTAD COULEE RD | 2 | | 19026 BENJAMIN LN | 2 | | 20985 CTY RD D | 2 | | 22581 S. MAIN ST | 2 | | 22787 S MAIN ST | 2 | | 22952 FAIRWAY AVE | 2 | | 23513 CTY RD T | 2 | | 25852 CTY RD C | 2 | | 2ND STREET | 2 |
| | | Fire incidents reported |
|---|
| Sreet name | Count |
|---|
| ABEL LN | 2 | | B.P GAS STATION | 2 | | BENJAMIN LN | 2 | | BOLGER RD | 2 | | BUCKHOLZ RD | 2 | | COUNTY RD D | 2 | | COUNTY RD D RD | 2 | | COUNTY RD DCOUNTY RD T | 2 | | CTR RD. D | 2 | | CTY D RD | 2 | | CTY RD D&T | 2 | | CTY RD DD | 2 | | CTY RD DD NORTH RIDGE RD | 2 | | CTY RD I | 2 | | CTY RD I & HASS LANE | 2 | | CTY T | 2 | | CTY. RD. C & LUNDE COULEE | 2 | | DOCKEN LN | 2 | | FLATTEN RD | 2 | | HWY 53 HWY | 2 | | JOE COULEE RD | 2 | | MAIN ST | 2 | | MAIN STREET | 2 | | MASON ROAD LGTS | 2 | | MCCABE LN | 2 |
|
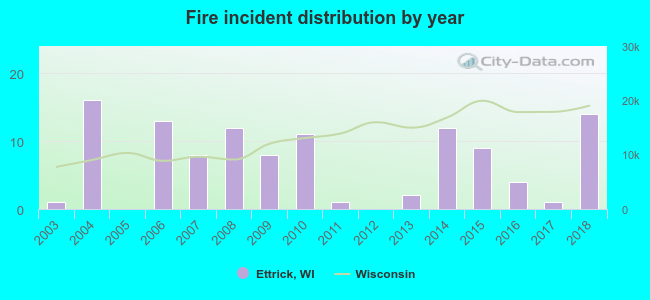 Based on the data from the years 2003 - 2018 the average number of fires per year is 7. The highest number of fires - 16 took place in 2004, and the least - 0 in 2005. The data has a growing trend.
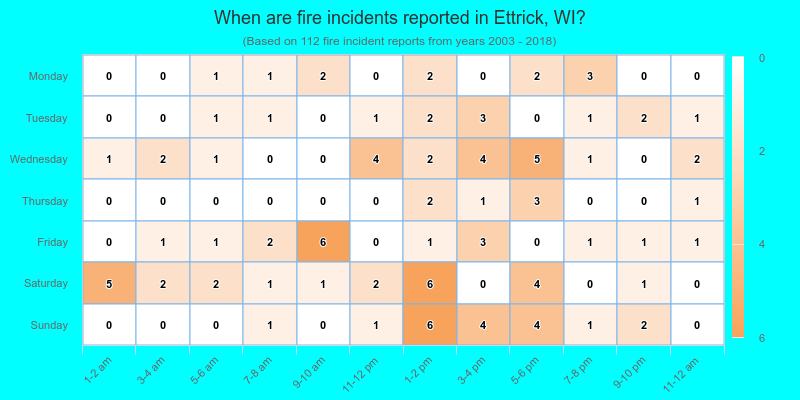
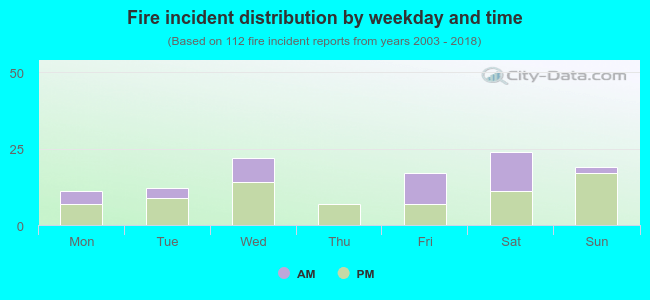 35.7% incidents where reported in the morning and 64.3% in the evening. The most fires (21.4%) took place on Saturday, and the least (6.3%) on Thursday.
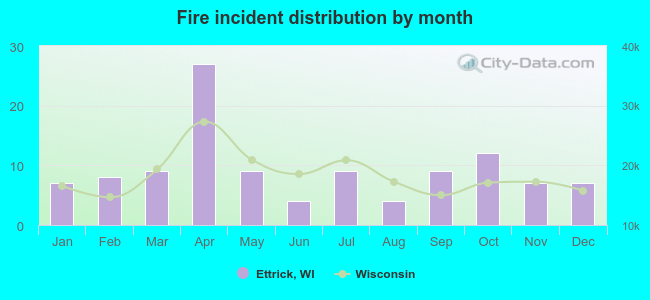 Based on the 112 fire incident reports from years 2003 - 2018 most fires (24.1%) took place during April, and the least (3.6%) in June.
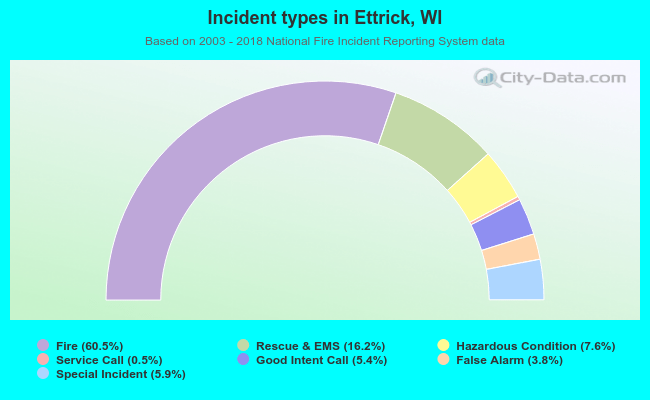 Out of all 185 cases reported during the years 2003 - 2018, the most belonged to the categories: Fire (60.5%), Overpressure Rupture (16.2%), and Rescue & EMS (7.6%).
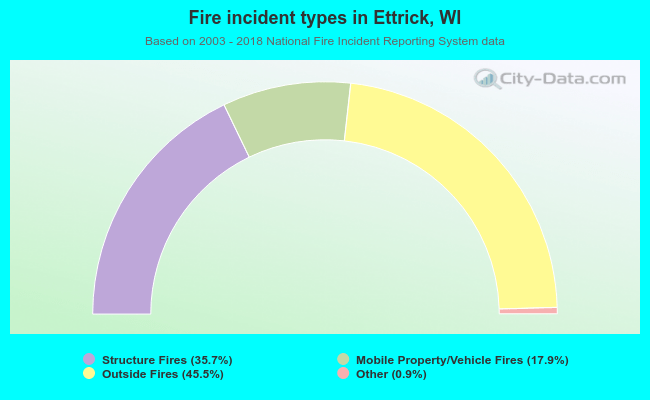 When looking into fire subcategories, the most reports belonged to: Outside Fires (45.5%), and Structure Fires (35.7%).