| Fire incidents reported |
|---|
| Sreet name | Count |
|---|
| HWY 167 | 40 | | SIMSTOWN RD | 16 | | HWY 56 | 10 | | EVENING SHADE | 8 | | HICKORY FLAT RD | 8 | | MAIN ST | 8 | | 432 SPRING ST | 6 | | ARK 56 HWY | 6 | | BACKBONE RD | 6 | | BACKBONE RD | 6 | | CAMPGROUND RD | 6 | | CARPENTER RD | 6 | | GOOD EARTH POTTERY RD | 6 | | HWY 167 HWY | 6 | | MEDLEY RD. | 6 | | 124 HANCOCK LANE | 4 | | 1707 HWY 167 | 4 | | 177 SORRELL RD | 4 | | 2393 HWY.167 | 4 | | 2572 ZION RD | 4 | | 354 HWY | 4 | | 500 BARNES RD | 4 | | 80 GOOD EARTH POTTERY RD. | 4 | | ANTIOCH RD | 4 | | ARK 56 | 4 |
| | | Fire incidents reported |
|---|
| Sreet name | Count |
|---|
| ARK HIGHWAY 56 | 4 | | BACKBONE RD. | 4 | | BARNES RD | 4 | | BEAR CREEK RD | 4 | | CARPENTER RD. | 4 | | CEMETARY LOOP | 4 | | CIRCLE DR | 4 | | EVENING SHADE DR. | 4 | | GOOD EARTH POTTERY RD | 4 | | HWY 167 N | 4 | | HWY 167 N. | 4 | | JANET LANE | 4 | | OLD HWY 11 | 4 | | SILVER SPRINGS RD. | 4 | | 10 IN THE PINES | 2 | | 1011 SIMSTOWN ROAD | 2 | | 103 WOLFE TRAIL | 2 | | 107 CAMMACK ST | 2 | | 11 PARK DR | 2 | | 1100 BEAR CREEK RD | 2 | | 112 HANCOCK LANE | 2 | | 113 CAMMACK | 2 | | 119 MEDLEY RD | 2 | | 120 MAIN ST. | 2 | | |
|
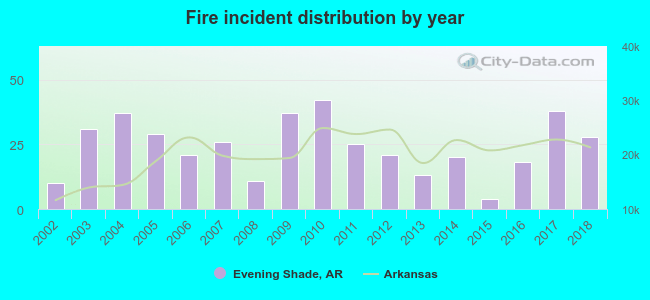 Based on the data from the years 2002 - 2018 the average number of fire incidents per year is 24. The highest number of reported fire incidents - 42 took place in 2010, and the least - 4 in 2015. The data has a rising trend.
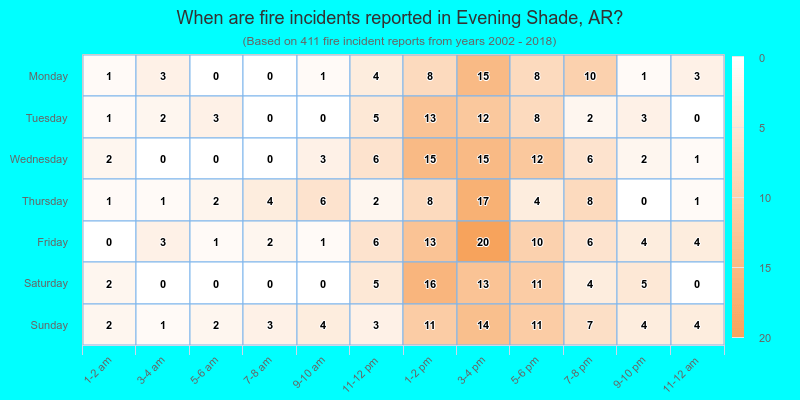
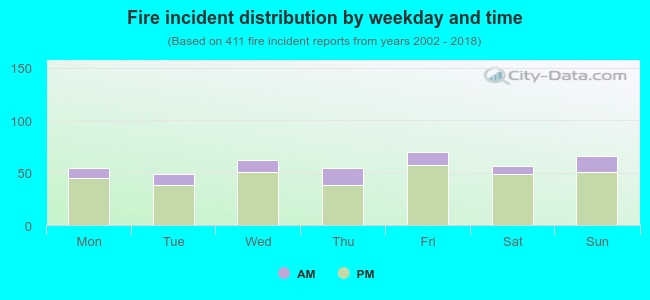 20.0% incidents where reported in the morning and 80.0% in the evening. The most fires (17.0%) took place on Friday, and the least (11.9%) on Tuesday.
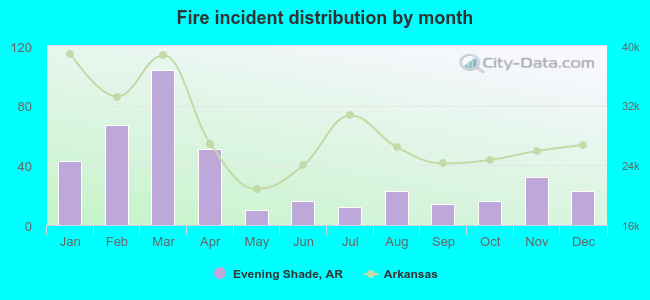 According to the 411 fire incident reports from years 2002 - 2018 most fires (25.3%) took place during March, and the least (2.4%) in May.
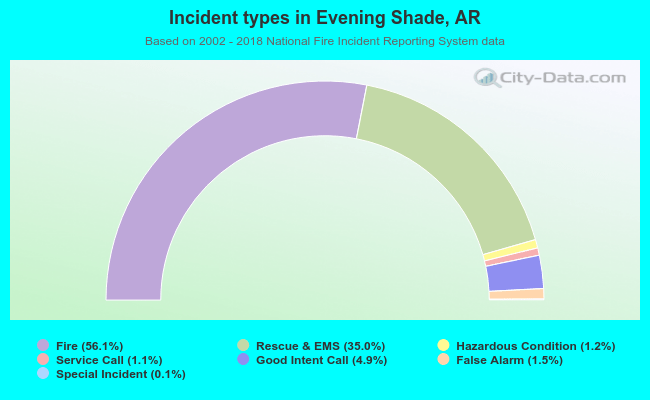 Out of all 732 cases reported during the years 2002 - 2018, the most belonged to the categories: Fire (56.1%), Overpressure Rupture (35.0%), and Service Call (4.9%).
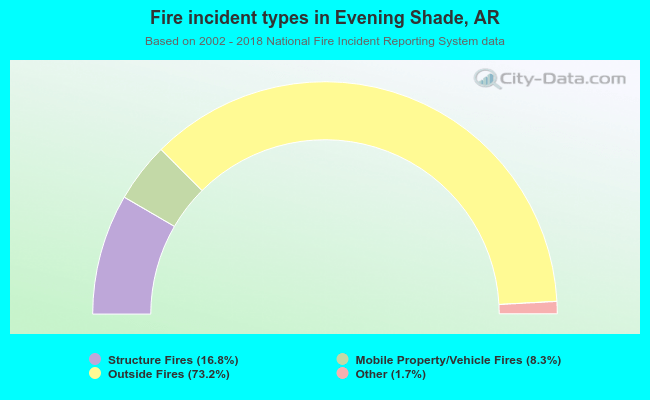 When looking into fire subcategories, the most reports belonged to: Outside Fires (73.2%), and Structure Fires (16.8%).