Exeter: Fire Incidents, Rhode Island (RI)
Where are fire incidents reported in Exeter, RI
Something went wrong! Please refresh the page.
|
| |||||||||||||||||||||||||||||||||||||||||||||||||||||||||||||||||||||||||||||||||||||||||||||||||||||||||||||
2007 - 2018 National Fire Incident Reporting System (NFIRS) incidents
- Incident types reported to NFIRS in Exeter, RI
- 77445.7%Rescue & EMS
- 23814.1%Fire
- 22913.5%False Alarm
- 17310.2%Hazardous Condition
- 1257.4%Good Intent Call
- 1096.4%Service Call
- 311.8%Severe Weather
- 140.8%Special Incident
- Fire incident types reported to NFIRS in Exeter, RI
- 13757.6%Structure Fires
- 6125.6%Outside Fires
- 2811.8%Mobile Property/Vehicle Fires
- 125.0%Other
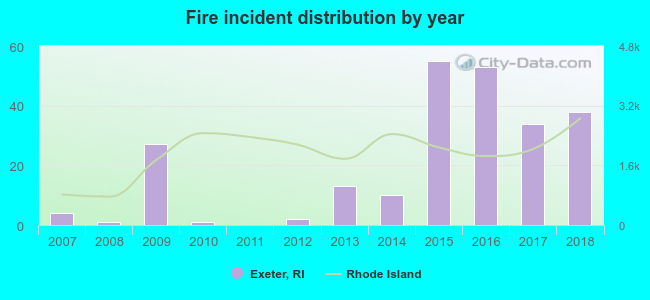 According to the data from the years 2007 - 2018 the average number of fire incidents per year is 20. The highest number of fires - 55 took place in 2015, and the least - 0 in 2011. The data has a growing trend.
The average number of yearly fire incidents per 10k residents in Exeter, RI compared to nearest cities:
(Note: Based on data for the last 3 years, including only cities with population 5,000 and above)
| Exeter: | 64.9 |
| West Greenwich: | 62.5 |
| Richmond: | 11.7 |
| Kingston: | 35.8 |
| North Kingstown: | 5.3 |
| East Greenwich: | 23.6 |
| Coventry: | 21.0 |
| South Kingstown: | 15.7 |
| Hopkinton: | 4.5 |
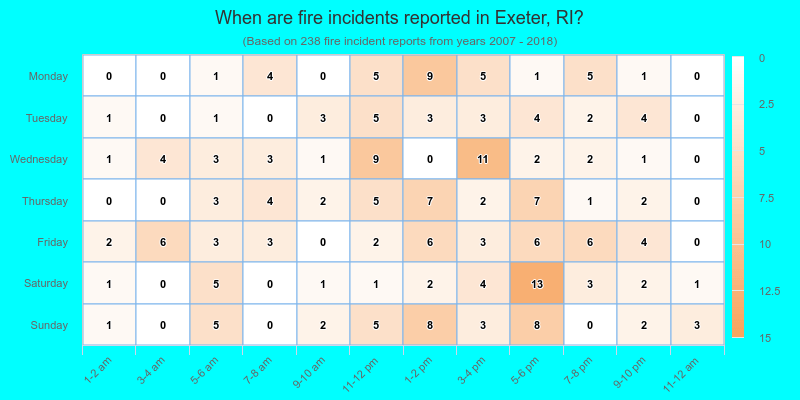
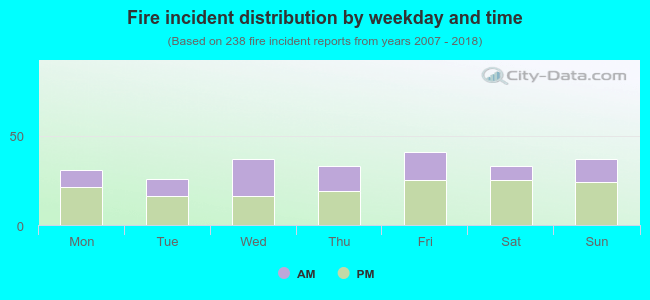 38.7% incidents where reported in the morning and 61.3% in the evening. The most fires (17.2%) took place on Friday, and the least (10.9%) on Tuesday.
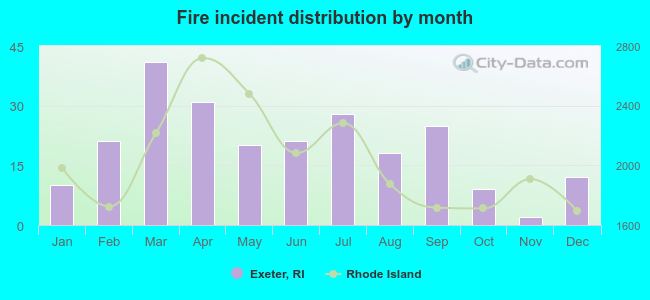 According to the 238 fire incidents from years 2007 - 2018 most fires (17.2%) took place during March, and the least (0.8%) in November.
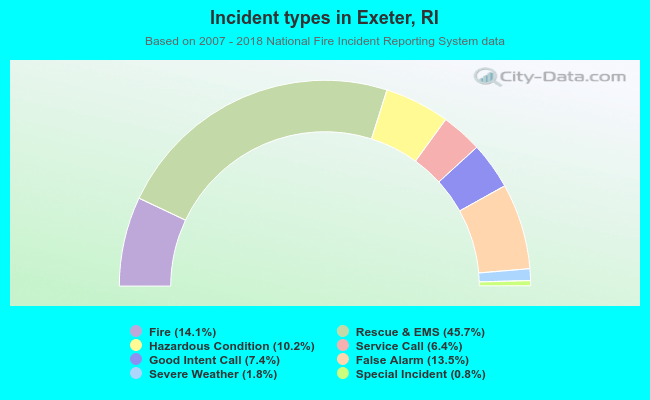 Out of all 1,693 cases reported during the years 2007 - 2018, the most belonged to the categories: Overpressure Rupture (45.7%), Fire (14.1%), and Good Intent Call (13.5%).
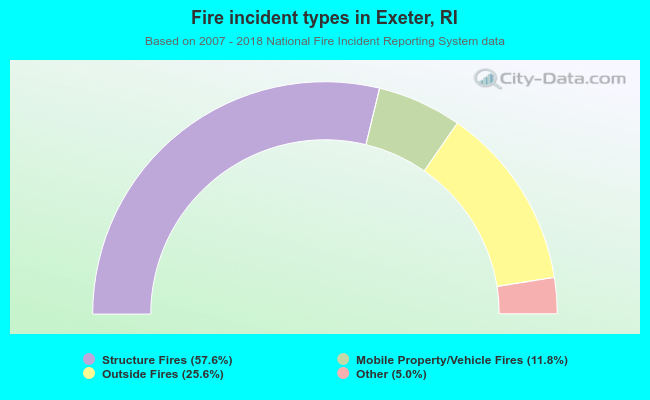 When looking into fire subcategories, the most incidents belonged to: Structure Fires (57.6%), and Outside Fires (25.6%).