| Fire incidents reported |
|---|
| Sreet name | Count |
|---|
| APPALACHIAN DR | 28 | | FIELD AVE | 22 | | THE GREAT RD | 18 | | DILLONS FORK RD | 12 | | 1 FIELD AVE | 8 | | 1 RIVER ROAD | 8 | | CLYDE PRILLAMAN ST | 8 | | 1290 VALLEY DRIVE | 6 | | CREEK RD | 6 | | 1 DILLONS FORK ROAD | 4 | | 1300 DILLIONS FORK ROAD | 4 | | 4210 THE GREAT ROAD | 4 | | 456 PATRICK AVE | 4 | | 824 KOEHLER ROAD | 4 | | ATLAS DR | 4 | | CARVER ROAD | 4 | | CHESTNUT ST | 4 | | DANIELS CREEK RD | 4 | | FIELD AVE | 4 | | HIGH RIDGE ST | 4 | | HUDSON RD | 4 | | JOHN BAKER RD | 4 | | KOGERTOWN RD | 4 | | MERRIMAN RD | 4 | | PINE ST | 4 |
| | | Fire incidents reported |
|---|
| Sreet name | Count |
|---|
| RIVER RD | 4 | | SEVENTH ST | 4 | | STONES DAIRY RD | 4 | | THE GREAT ROAD | 4 | | VALLEY DR | 4 | | 1 200 BYPASS 641 EXIT | 2 | | 1 220 BYPASS BYP | 2 | | 1 220 SOUTH BOUND | 2 | | 1 APPALACHIAN DR | 2 | | 1 APPALACHIAN DRIVE | 2 | | 1 BREEZE WAY | 2 | | 1 CARVER ROAD | 2 | | 1 CHESTNUT ST | 2 | | 1 CHESTNUT ST | 2 | | 1 CHESTNUT STREET | 2 | | 1 DILLION FORK RD | 2 | | 1 DILLIONS FORK RD | 2 | | 1 DILLIONS FORK RD | 2 | | 1 FRANK WILSON AVENUE | 2 | | 1 PATRICK AVE | 2 | | 1 RANGELEY DRIVE | 2 | | 1 TANYARD ROAD | 2 | | 1 TENTH STREET | 2 | | 1 WILLIAM F STONE | 2 | | |
|
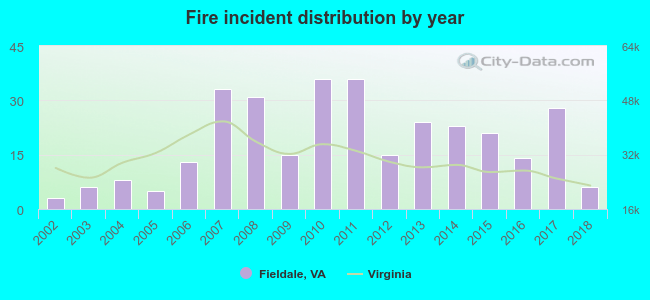 According to the data from the years 2002 - 2018 the average number of fire incidents per year is 19. The highest number of fire incidents - 36 took place in 2010, and the least - 3 in 2002. The data has a growing trend.
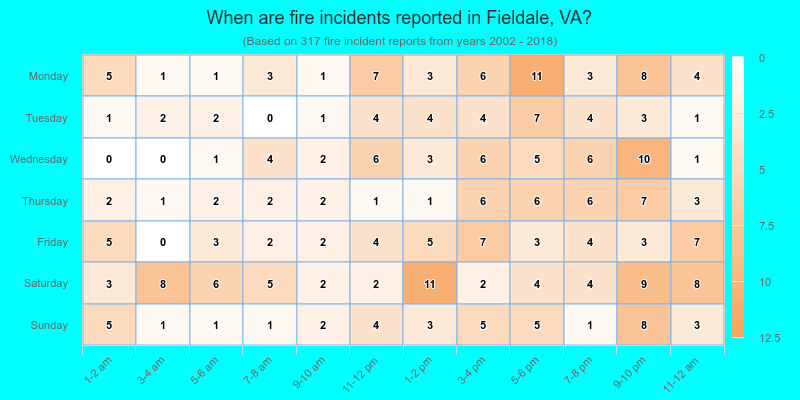
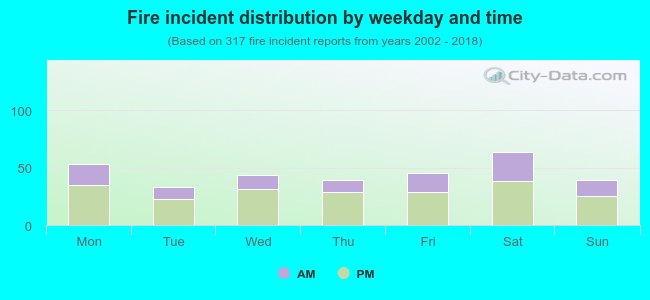 33.8% incidents where reported in the morning and 66.2% in the evening. The most fires (20.2%) took place on Saturday, and the least (10.4%) on Tuesday.
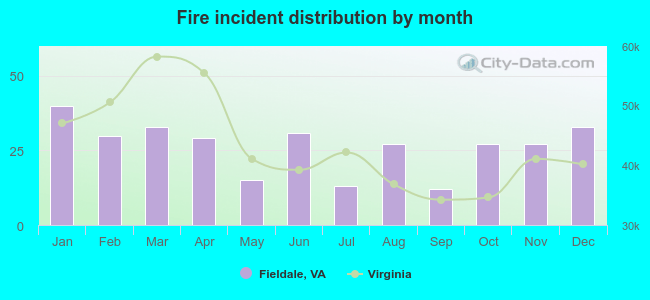 Based on the 317 incident reports from years 2002 - 2018 most fires (12.6%) took place during January, and the least (3.8%) in September.
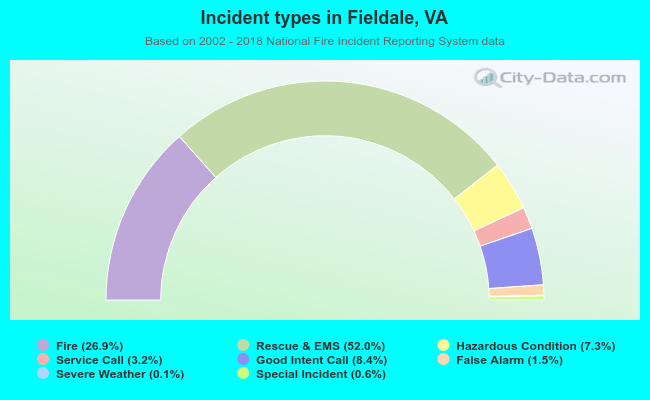 Out of all 1,180 cases reported during the years 2002 - 2018, the most belonged to the categories: Overpressure Rupture (52.0%), Fire (26.9%), and Service Call (8.4%).
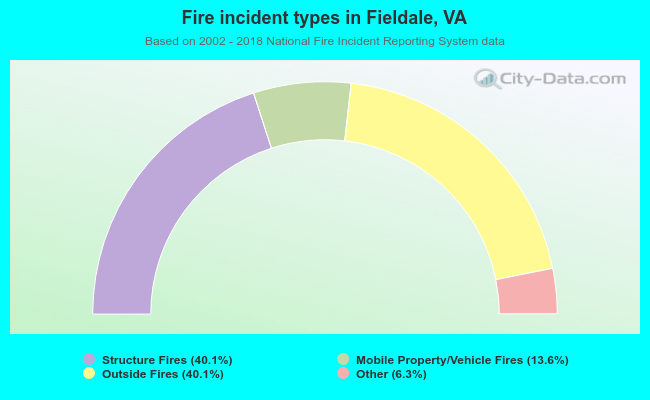 When looking into fire subcategories, the most incidents belonged to: Structure Fires (40.1%), and Outside Fires (40.1%).