| Fire incidents reported |
|---|
| Sreet name | Count |
|---|
| CENTER HILL RD | 36 | | SWEET LIPS RD | 26 | | FINGER LEAPWOOD RD | 24 | | OLD FRIENDSHIP RD | 22 | | HIGHWAY 45 | 16 | | OLD FINGER RD | 16 | | SOL COLSTON RD | 16 | | DROKE RD | 14 | | LITT WILSON RD | 14 | | GEORGE NAYLOR LN | 10 | | DROKE ST | 8 | | YOUNG RD | 8 | | BULLMAN RD | 6 | | OLD FINGER RD | 6 | | OLD FRIENDSHIP RD | 6 | | APPLE ST | 4 | | BEENE RD | 4 | | BEENE RD | 4 | | CECIL THOMAS RD | 4 | | CONNER RD | 4 | | DUBERRY RD | 4 | | FINGERLEAPWOOD RD | 4 | | HIGH SMITH RD | 4 | | HOPEWELL CHURCH RD | 4 | | HUBANKS RD | 4 |
| | | Fire incidents reported |
|---|
| Sreet name | Count |
|---|
| J C PICKETT RD | 4 | | MASSEYVILLE MCNAIRY RD | 4 | | MOUNT CARMEL RD | 4 | | OLD FINGER RD. | 4 | | OLD FINGER ROAD | 4 | | OLD FRIENDSHIP RD. | 4 | | PATTERSON LN | 4 | | PLEASANT RIDGE RD | 4 | | ROCKY KNOB RD | 4 | | SHELLEY LN | 4 | | SOL COLSTON ROAD | 4 | | SOL COLSTROM ROAD | 4 | | SWEETLIPS RD | 4 | | SWEETLIPS RD | 4 | | OLD FRIENDSHIP RD | 2 | | 100 MONTEZUMA RD | 2 | | 110 JEFF RD | 2 | | 120 DROKE RD | 2 | | 300 JAMES PATTERSON RD | 2 | | BEAUTYHILL RD | 2 | | BEEN RD | 2 | | BEENE ROAD | 2 | | BISHOP LOOP | 2 | | BISHOP LOOP & HILLARD GANN LN JCT | 2 | | BISHOP RD | 2 |
|
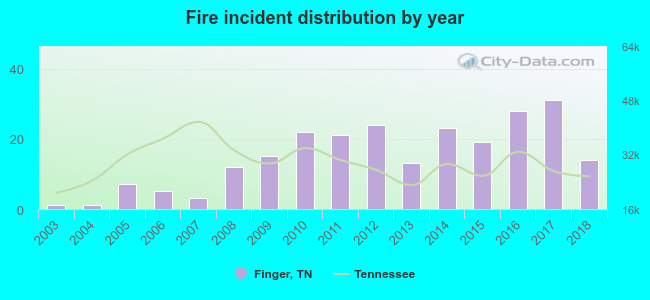 According to the data from the years 2003 - 2018 the average number of fires per year is 15. The highest number of fires - 31 took place in 2017, and the least - 1 in 2003. The data has a growing trend.
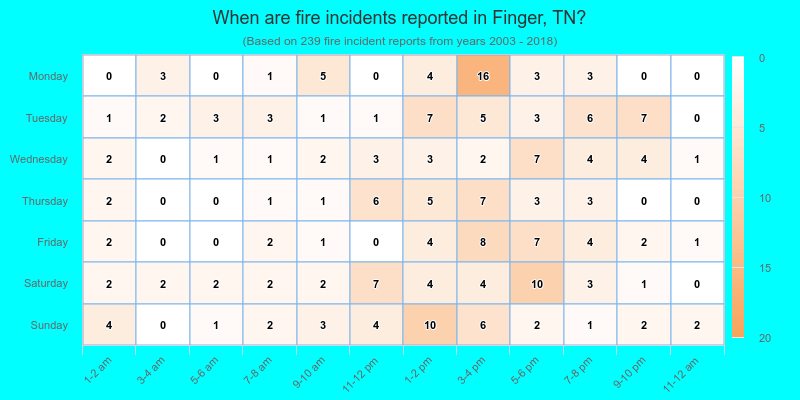
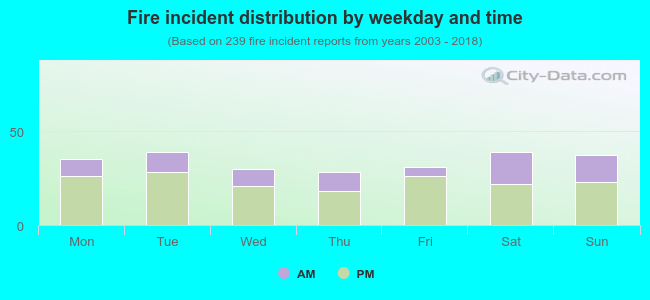 31.4% incidents where reported in the morning and 68.6% in the evening. The most fires (16.3%) took place on Tuesday, and the least (11.7%) on Thursday.
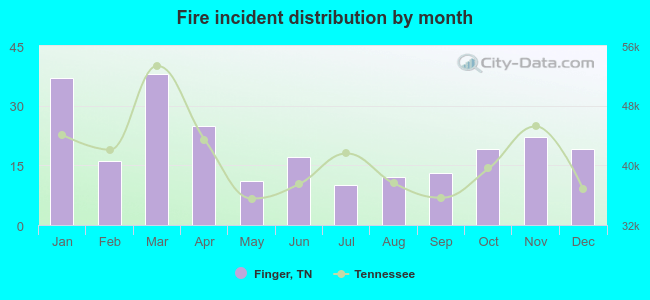 Based on the 239 incident reports from years 2003 - 2018 most fires (15.9%) took place during March, and the least (4.2%) in July.
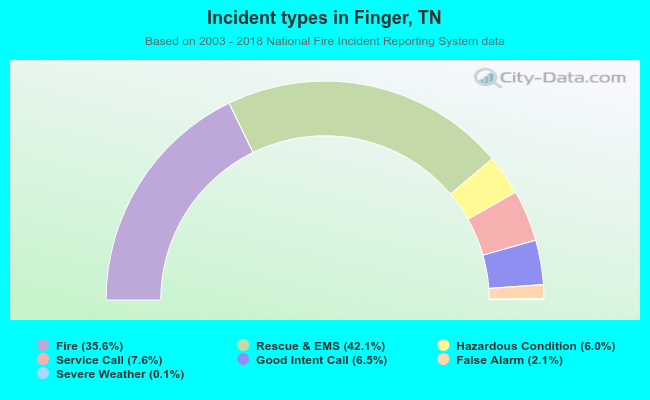 Out of all 672 cases reported during the years 2003 - 2018, the most belonged to the categories: Overpressure Rupture (42.1%), Fire (35.6%), and Hazardous Condition (7.6%).
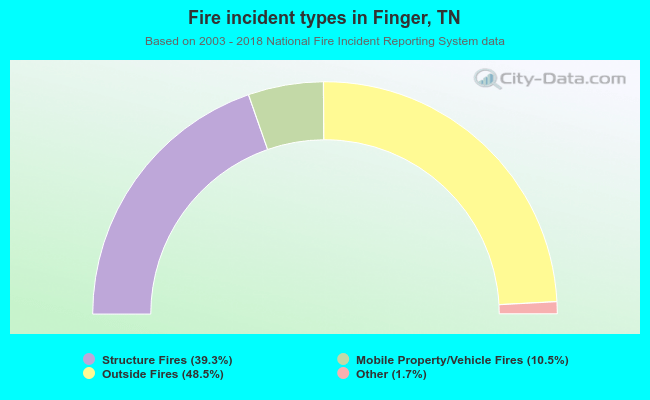 When looking into fire subcategories, the most reports belonged to: Outside Fires (48.5%), and Structure Fires (39.3%).