Florence: Fire Incidents, Arizona (AZ)
Where are fire incidents reported in Florence, AZ
Something went wrong! Please refresh the page.
|
| |||||||||||||||||||||||||||||||||||||||||||||||||||||||||||||||||||||||||||||||||||||||||||||||||||||||||||||
2005 - 2018 National Fire Incident Reporting System (NFIRS) incidents
- Incident types reported to NFIRS in Florence, AZ
- 59743.6%Fire
- 34825.4%Rescue & EMS
- 27019.7%Hazardous Condition
- 795.8%Service Call
- 594.3%Good Intent Call
- 120.9%False Alarm
- 50.4%Special Incident
- Fire incident types reported to NFIRS in Florence, AZ
- 31753.1%Outside Fires
- 13522.6%Structure Fires
- 8514.2%Mobile Property/Vehicle Fires
- 6010.1%Other
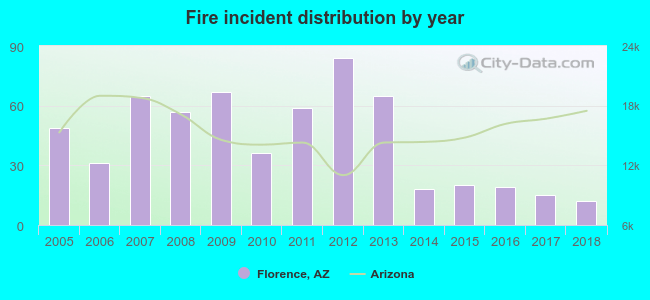 Based on the data from the years 2005 - 2018 the average number of fires per year is 43. The highest number of fire incidents - 84 took place in 2012, and the least - 12 in 2018. The data has a dropping trend.
The average number of yearly fire incidents per 10k residents in Florence, AZ compared to nearest cities:
(Note: Based on data for the last 3 years, including only cities with population 5,000 and above)
| Florence: | 5.7 |
| Coolidge: | 51.9 |
| San Tan Valley: | 0.3 |
| Queen Creek: | 21.4 |
| Eloy: | 54.6 |
| Casa Grande: | 35.5 |
| Gila River: | 1.4 |
| Arizona City: | 29.1 |
| Apache Junction: | 8.3 |
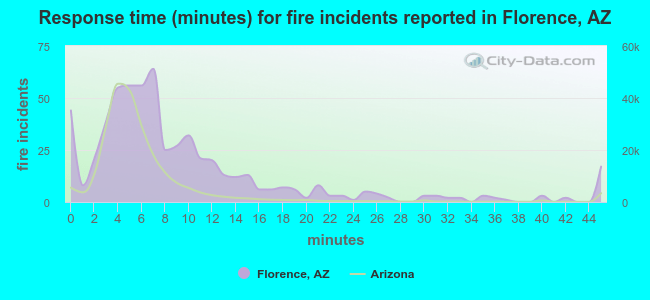 The median response time based on all reported fire incidents is 7 minutes. This is higher compared to the state median value.
The median response time in Florence, AZ compared to nearest cities:
(Note: Based on data for all years, including only cities with at least 500 fire incidents)
| Florence: | 7 minutes |
| Coolidge: | 6 minutes |
| Queen Creek: | 6 minutes |
| Eloy: | 7 minutes |
| Casa Grande: | 6 minutes |
| Apache Junction: | 6 minutes |
| Gilbert: | 5 minutes |
| Chandler: | 5 minutes |
| Mesa: | 5 minutes |
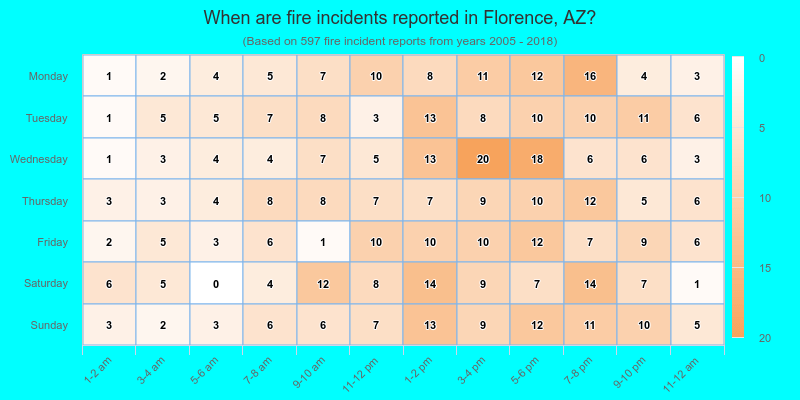
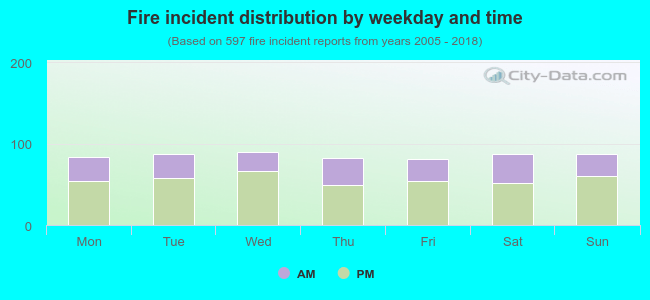 34.2% incidents where reported in the morning and 65.8% in the evening. The most fires (15.1%) took place on Wednesday, and the least (13.6%) on Friday.
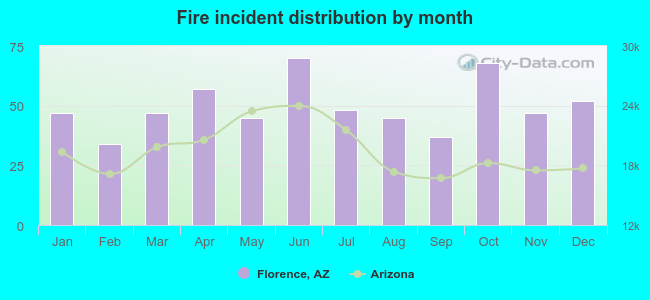 According to the 597 fires from years 2005 - 2018 most fires (11.7%) took place during June, and the least (5.7%) in February.
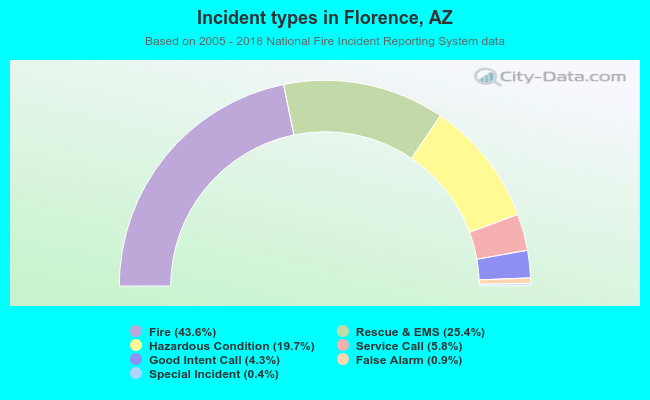 Out of all 1,370 cases reported during the years 2005 - 2018, the most belonged to the categories: Fire (43.6%), Overpressure Rupture (25.4%), and Rescue & EMS (19.7%).
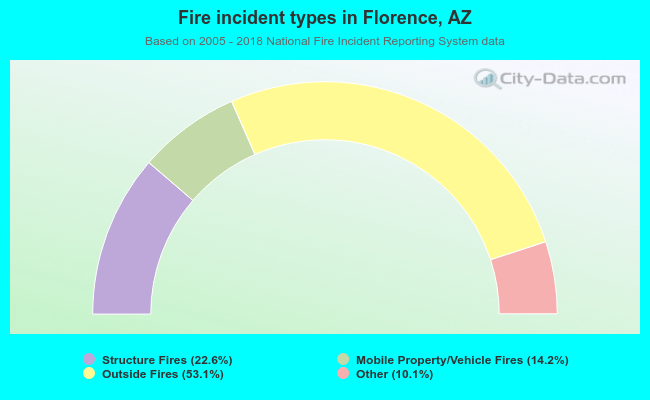 When looking into fire subcategories, the most reports belonged to: Outside Fires (53.1%), and Structure Fires (22.6%).