Fresno: Fire Incidents, Ohio (OH)
Where are fire incidents reported in Fresno, OH
Something went wrong! Please refresh the page.
|
| |||||||||||||||||||||||||||||||||||||||||||||||||||||||||||||||||||||||||||||||||||||||||||||||||||||||||||||
2002 - 2018 National Fire Incident Reporting System (NFIRS) incidents
- Incident types reported to NFIRS in Fresno, OH
- 26152.9%Fire
- 11022.3%Hazardous Condition
- 7515.2%Rescue & EMS
- 224.5%Good Intent Call
- 142.8%Service Call
- 51.0%False Alarm
- 40.8%Severe Weather
- 20.4%Special Incident
- Fire incident types reported to NFIRS in Fresno, OH
- 14254.4%Structure Fires
- 8934.1%Outside Fires
- 2911.1%Mobile Property/Vehicle Fires
- 10.4%Other
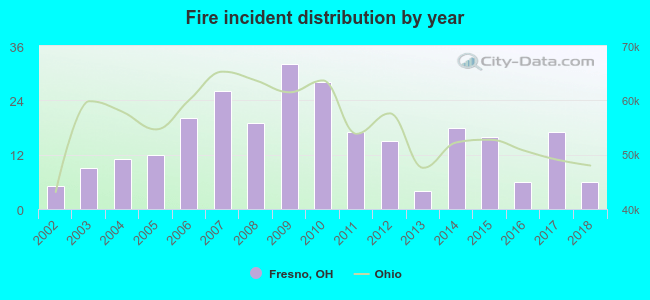 Based on the data from the years 2002 - 2018 the average number of fires per year is 15. The highest number of reported fire incidents - 32 took place in 2009, and the least - 4 in 2013. The data has an increasing trend.
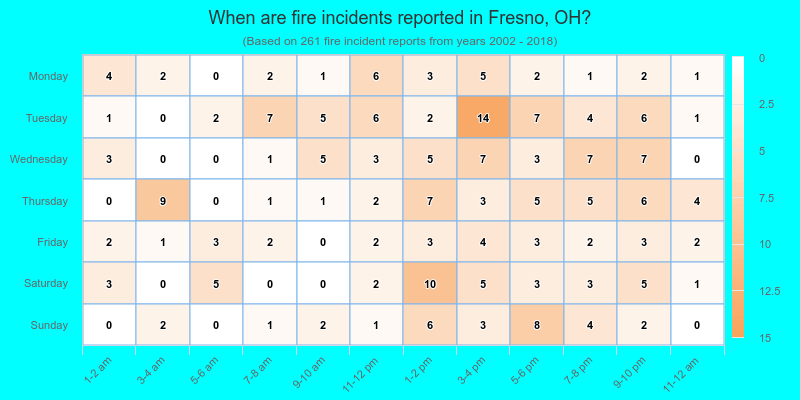
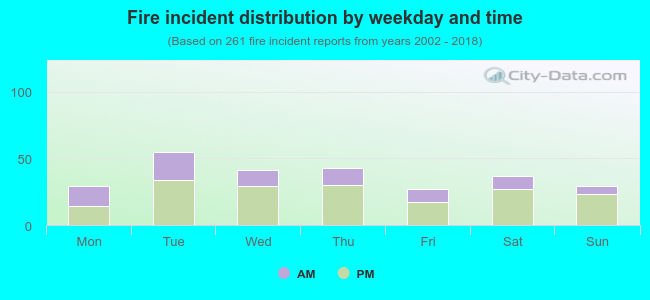 33.3% incidents where reported in the morning and 66.7% in the evening. The most fires (21.1%) took place on Tuesday, and the least (10.3%) on Friday.
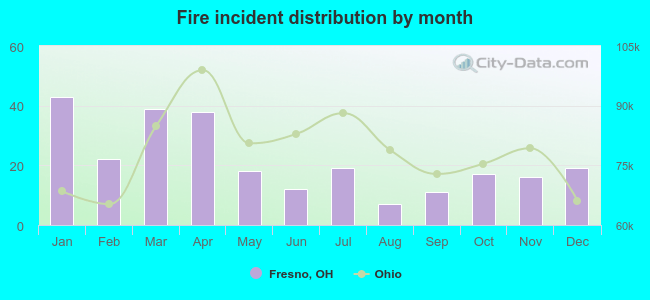 According to the 261 incident reports from years 2002 - 2018 most fires (16.5%) took place during January, and the least (2.7%) in August.
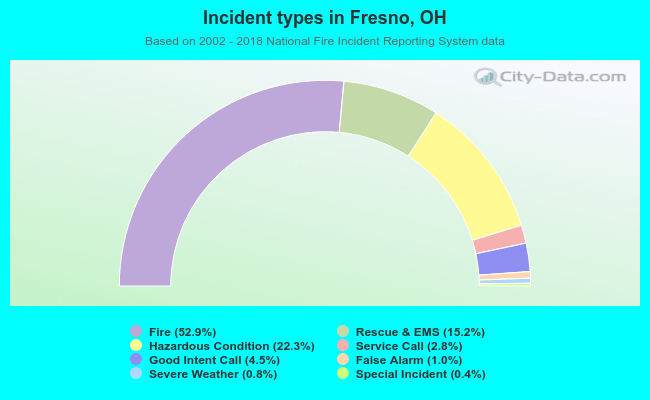 Out of all 493 cases reported during the years 2002 - 2018, the most belonged to the categories: Fire (52.9%), Rescue & EMS (22.3%), and Overpressure Rupture (15.2%).
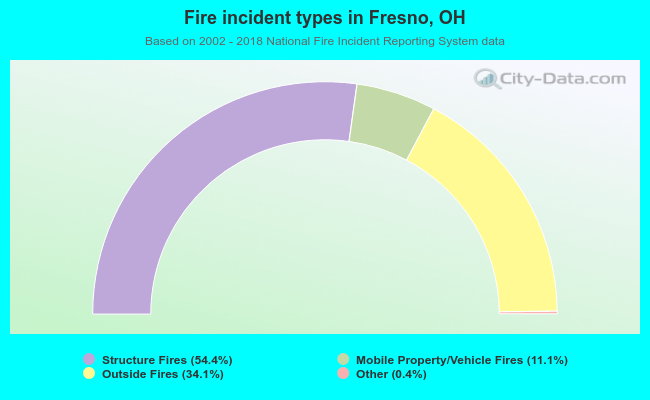 When looking into fire subcategories, the most reports belonged to: Structure Fires (54.4%), and Outside Fires (34.1%).