Galesburg: Fire Incidents, Michigan (MI)
Where are fire incidents reported in Galesburg, MI
Something went wrong! Please refresh the page.
|
| |||||||||||||||||||||||||||||||||||||||||||||||||||||||||||||||||||||||||||||||||||||||||||||||||||||||||||||
2002 - 2018 National Fire Incident Reporting System (NFIRS) incidents
- Incident types reported to NFIRS in Galesburg, MI
- 1,34656.7%Rescue & EMS
- 43718.4%Fire
- 1877.9%Hazardous Condition
- 1777.5%Good Intent Call
- 1426.0%Service Call
- 813.4%False Alarm
- Fire incident types reported to NFIRS in Galesburg, MI
- 19845.3%Structure Fires
- 13631.1%Outside Fires
- 8719.9%Mobile Property/Vehicle Fires
- 163.7%Other
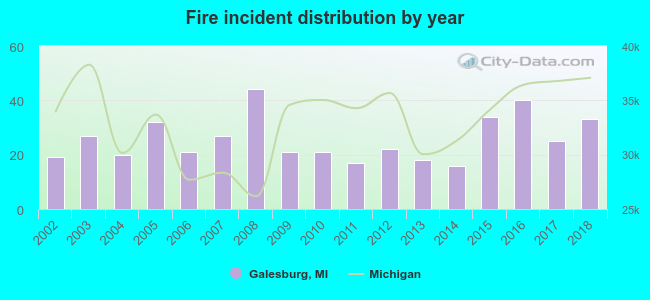 Based on the data from the years 2002 - 2018 the average number of fire incidents per year is 26. The highest number of reported fire incidents - 44 took place in 2008, and the least - 16 in 2014. The data has an increasing trend.
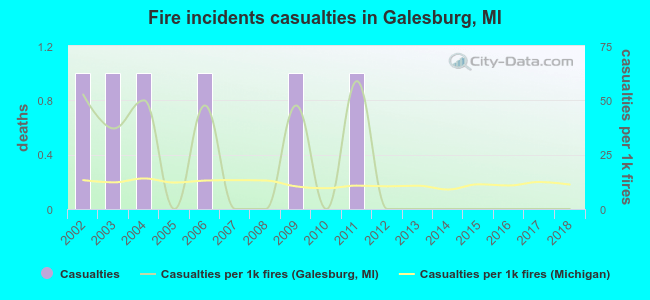 Based on the reports from the years 2002 - 2018 the average number of fire-related yearly casualties is 0. The highest number of reported injuries - 1 took place in 2002, and the lowest - 0 in 2005. The data has a declining trend.
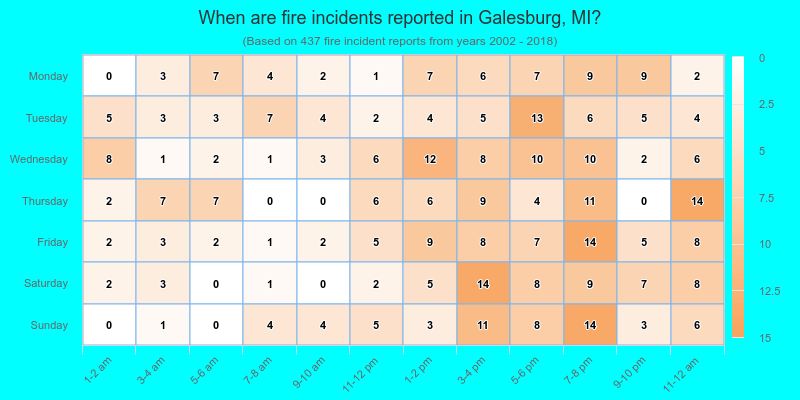
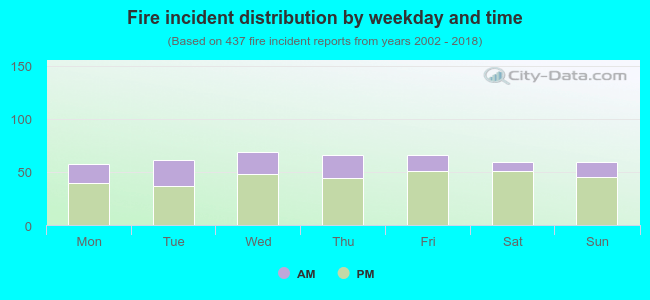 27.7% incidents where reported in the morning and 72.3% in the evening. The most fires (15.8%) took place on Wednesday, and the least (13.0%) on Monday.
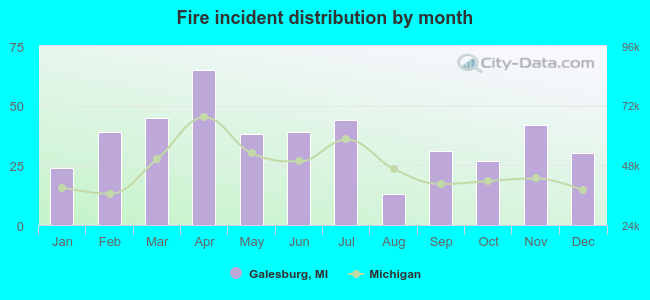 According to the 437 reports from years 2002 - 2018 most fires (14.9%) took place during April, and the least (3.0%) in August.
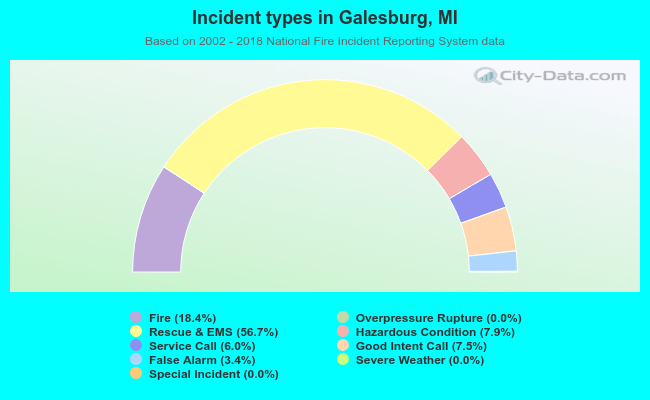 Out of all 2,373 cases reported during the years 2002 - 2018, the most belonged to the categories: Rescue & EMS (56.7%), Fire (18.4%), and Hazardous Condition (7.9%).
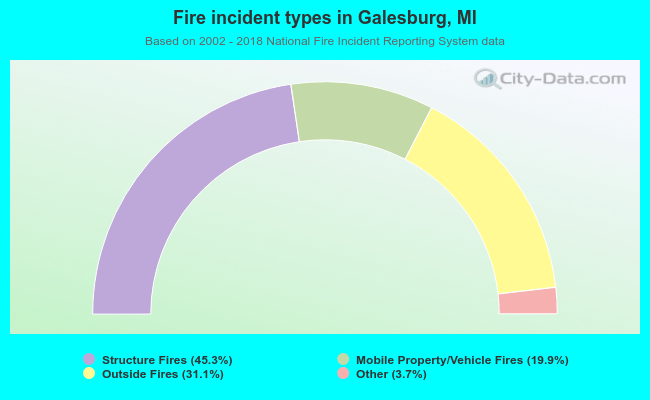 When looking into fire subcategories, the most incidents belonged to: Structure Fires (45.3%), and Outside Fires (31.1%).