Girard: Fire Incidents, Pennsylvania (PA)
Where are fire incidents reported in Girard, PA
Something went wrong! Please refresh the page.
|
| |||||||||||||||||||||||||||||||||||||||||||||||||||||||||||||||||||||||||||||||||||||||||||||||||||||||||||||
2004 - 2018 National Fire Incident Reporting System (NFIRS) incidents
- Incident types reported to NFIRS in Girard, PA
- 32947.6%Rescue & EMS
- 14821.4%Good Intent Call
- 10715.5%Fire
- 466.7%Hazardous Condition
- 334.8%Service Call
- 223.2%False Alarm
- 30.4%Severe Weather
- 20.3%Special Incident
- 10.1%Overpressure Rupture
- Fire incident types reported to NFIRS in Girard, PA
- 7570.1%Structure Fires
- 1615.0%Other
- 87.5%Mobile Property/Vehicle Fires
- 87.5%Outside Fires
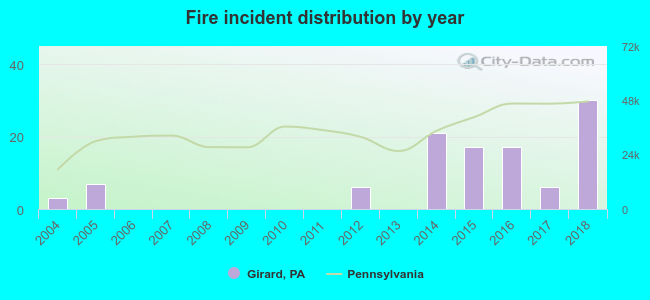 According to the data from the years 2004 - 2018 the average number of fire incidents per year is 7. The highest number of reported fires - 30 took place in 2018, and the least - 0 in 2006. The data has a rising trend.
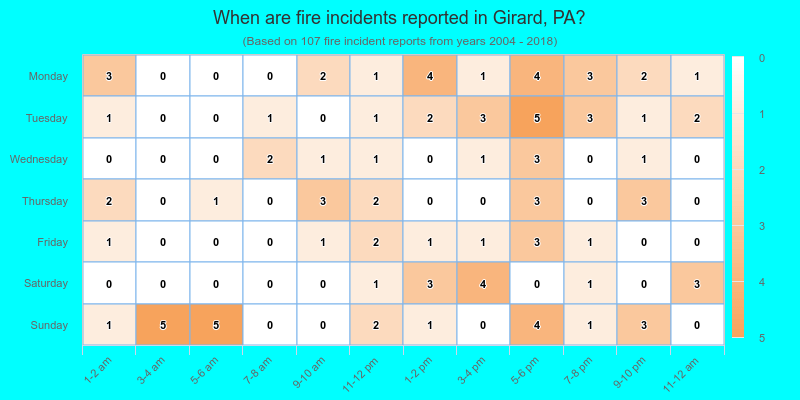
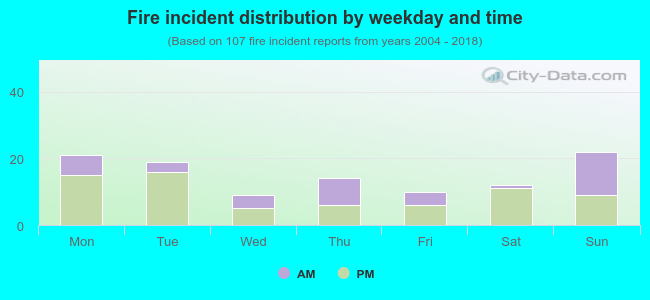 36.4% incidents where reported in the morning and 63.6% in the evening. The most fires (20.6%) took place on Sunday, and the least (8.4%) on Wednesday.
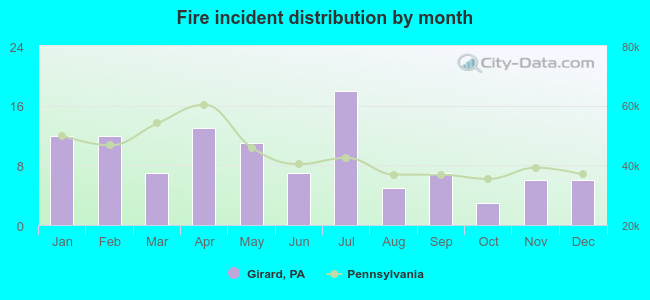 Based on the 107 incident reports from years 2004 - 2018 most fires (16.8%) took place during July, and the least (2.8%) in October.
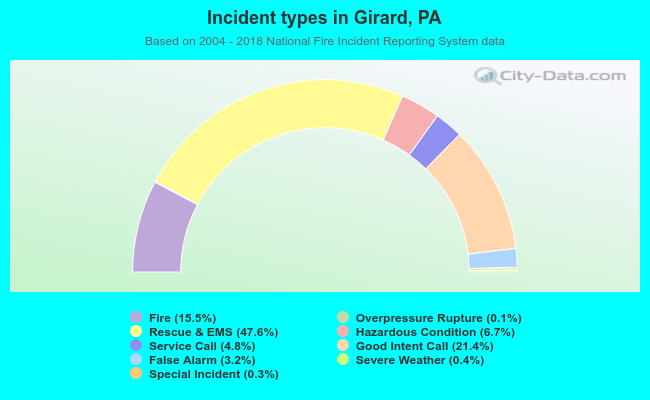 Out of all 691 cases reported during the years 2004 - 2018, the most belonged to the categories: Rescue & EMS (47.6%), Good Intent Call (21.4%), and Fire (15.5%).
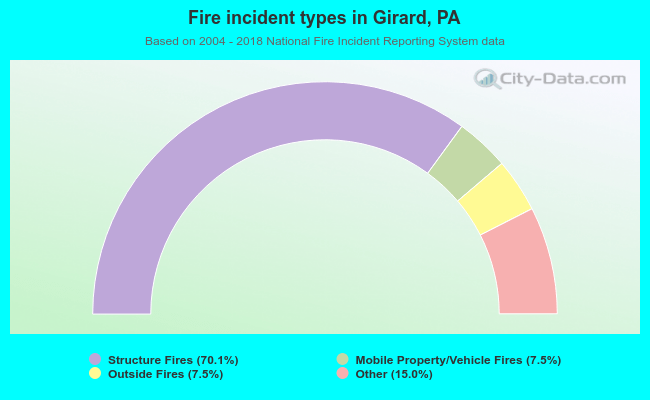 When looking into fire subcategories, the most incidents belonged to: Structure Fires (70.1%), and Other (15.0%).