Glenmont: Fire Incidents, Ohio (OH)
Where are fire incidents reported in Glenmont, OH
Something went wrong! Please refresh the page.
|
| |||||||||||||||||||||||||||||||||||||||||||||||||||||||||||||||||||||||||||||||||||||||||||||||||||||||||||||
2002 - 2018 National Fire Incident Reporting System (NFIRS) incidents
- Incident types reported to NFIRS in Glenmont, OH
- 21538.6%Fire
- 11921.4%Rescue & EMS
- 8615.4%Hazardous Condition
- 478.4%Good Intent Call
- 468.3%Service Call
- 173.1%Severe Weather
- 152.7%Special Incident
- 112.0%False Alarm
- 10.2%Overpressure Rupture
- Fire incident types reported to NFIRS in Glenmont, OH
- 10046.5%Outside Fires
- 9242.8%Structure Fires
- 198.8%Mobile Property/Vehicle Fires
- 41.9%Other
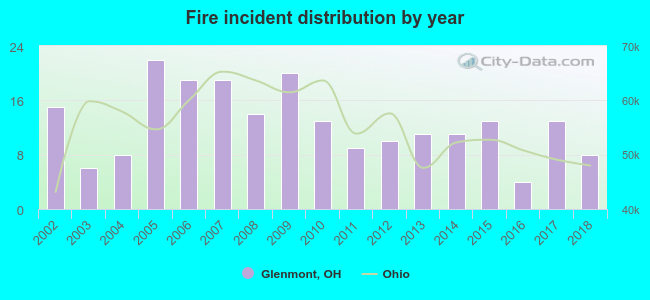 According to the data from the years 2002 - 2018 the average number of fire incidents per year is 13. The highest number of reported fires - 22 took place in 2005, and the least - 4 in 2016. The data has a decreasing trend.
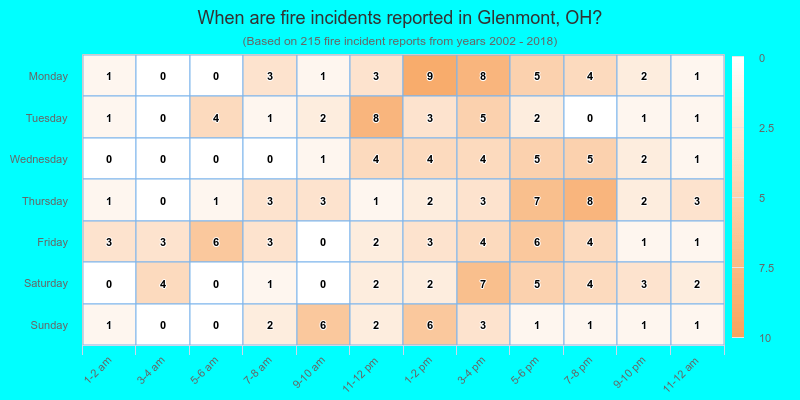
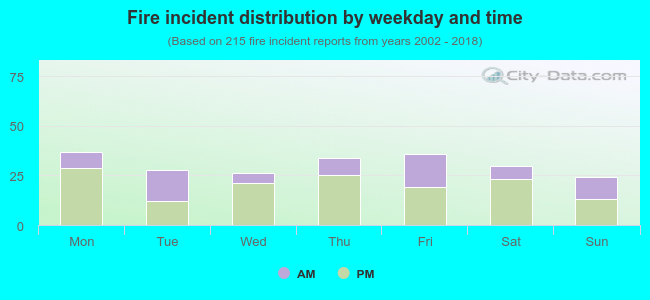 34.0% incidents where reported in the morning and 66.0% in the evening. The most fires (17.2%) took place on Monday, and the least (11.2%) on Sunday.
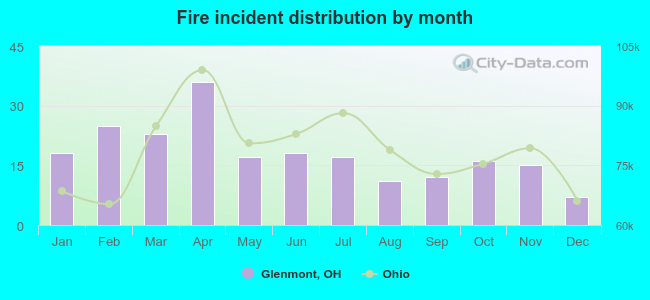 According to the 215 incident reports from years 2002 - 2018 most fires (16.7%) took place during April, and the least (3.3%) in December.
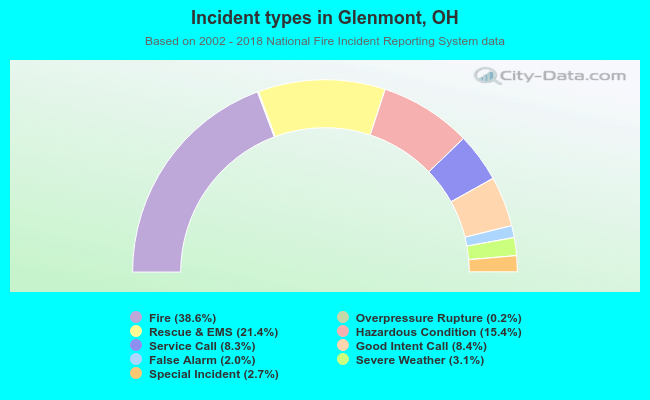 Out of all 557 cases reported during the years 2002 - 2018, the most belonged to the categories: Fire (38.6%), Rescue & EMS (21.4%), and Hazardous Condition (15.4%).
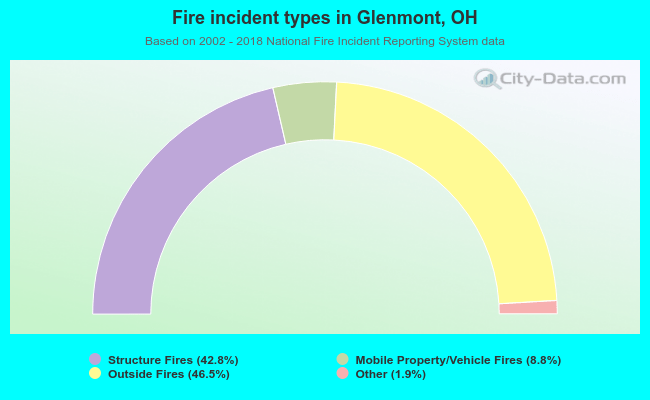 When looking into fire subcategories, the most reports belonged to: Outside Fires (46.5%), and Structure Fires (42.8%).