| Fire incidents reported |
|---|
| Sreet name | Count |
|---|
| LIBERTY RIDGE RD | 22 | | CROXFORD RD | 20 | | MAIN ST | 14 | | YATES RD | 14 | | STATE HIGHWAY 3 HWY | 12 | | OTTERVILLE RD | 10 | | POWERLINE RD | 10 | | SPRINGFIELD ST | 8 | | ELSAH RD | 6 | | ROWLING RIDGE RD | 6 | | RT 100 | 6 | | STATE HIGHWAY 100 HWY | 6 | | WATER ST | 6 | | BELTREE RD | 4 | | BLUFF RIDGE | 4 | | BRADFISH DR | 4 | | DABBS NORTH RD | 4 | | ECKERT ORCHARD RD | 4 | | HIGHWAY 100 | 4 | | MAIN | 4 | | PELICAN | 4 | | POSSUM TROT LA | 4 | | POWER LINE | 4 | | POWERLINE RD | 4 | | SUGAR HOLLOW RD | 4 |
| | | Fire incidents reported |
|---|
| Sreet name | Count |
|---|
| WILLOW ST | 4 | | BEATTY MOUND | 2 | | BLUE HERON DR | 2 | | BLUFF HILL DRIVE | 2 | | BLUFF RIDGE DRIVE | 2 | | CEDAR ST | 2 | | CHURCH ST | 2 | | CLINTON ST | 2 | | COMMANCHE LN | 2 | | CREEK RD | 2 | | EAST MAIN | 2 | | ELM ST | 2 | | FRONT | 2 | | GRAFTON HILLS | 2 | | GRAFTON HILLS DR | 2 | | HEAFNER LA | 2 | | LASALLE ST | 2 | | LIBERTY RIDGE | 2 | | LIBERTY RIDGE RD | 2 | | LIBERTY RIGGE | 2 | | MAIN ST. | 2 | | MARKET ST | 2 | | MCCLUSKY RD | 2 | | MEADOW BRANCH | 2 | | |
|
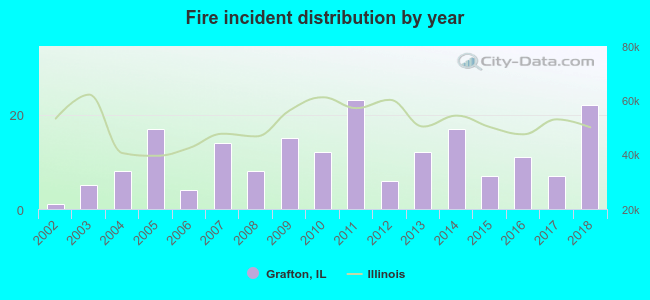 According to the data from the years 2002 - 2018 the average number of fires per year is 11. The highest number of reported fires - 23 took place in 2011, and the least - 1 in 2002. The data has a rising trend.
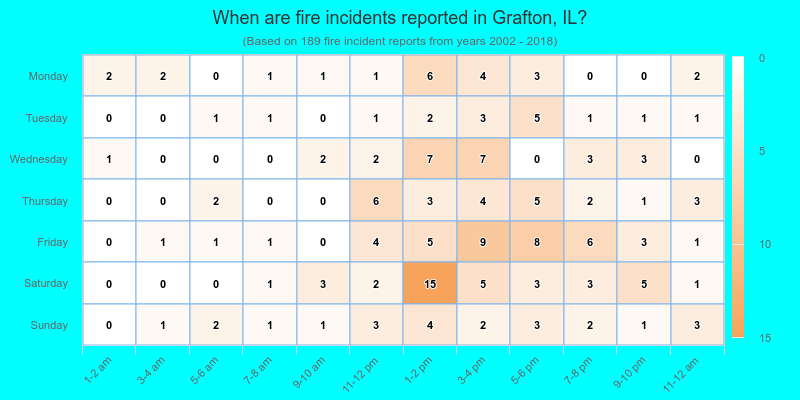
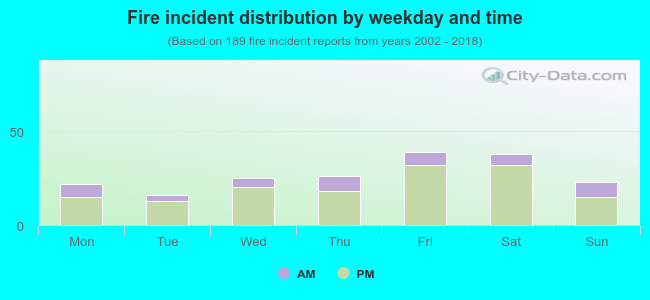 23.3% incidents where reported in the morning and 76.7% in the evening. The most fires (20.6%) took place on Friday, and the least (8.5%) on Tuesday.
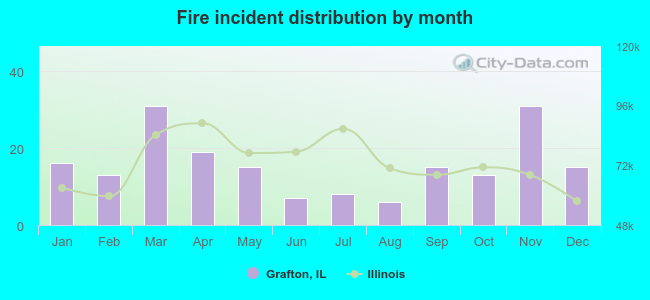 Based on the 189 reports from years 2002 - 2018 most fires (16.4%) took place during March, and the least (3.2%) in August.
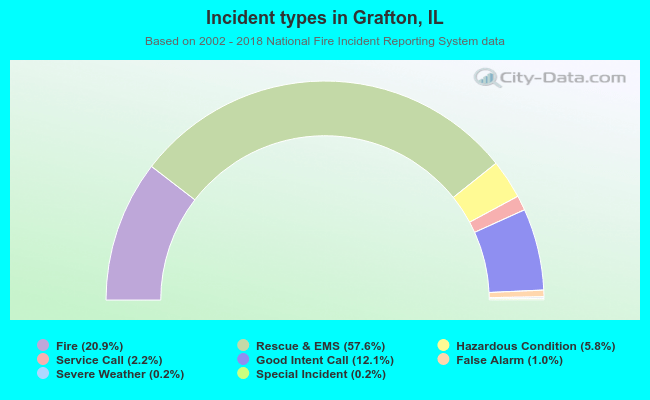 Out of all 904 cases reported during the years 2002 - 2018, the most belonged to the categories: Overpressure Rupture (57.6%), Fire (20.9%), and Service Call (12.1%).
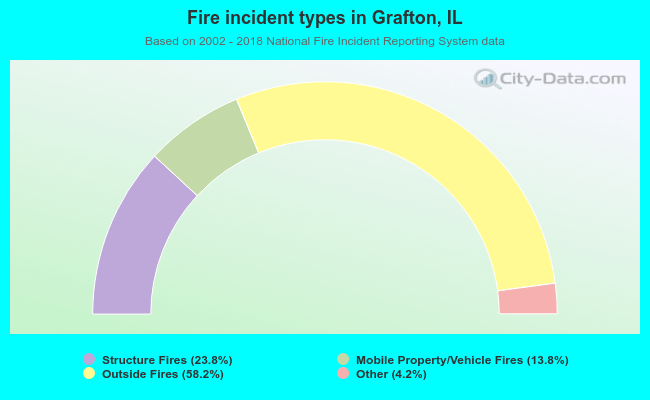 When looking into fire subcategories, the most reports belonged to: Outside Fires (58.2%), and Structure Fires (23.8%).