Grainfield: Fire Incidents, Kansas (KS)
Where are fire incidents reported in Grainfield, KS
Something went wrong! Please refresh the page.
|
| |||||||||||||||||||||||||||||||||||||||||||||||||||||||||||||||||||||||||||||
| Other | 13 | |||||||||||||||||||||||||||||||||||||||||||||||||||||||||||||||||||||||||||||
2005 - 2018 National Fire Incident Reporting System (NFIRS) incidents
- Incident types reported to NFIRS in Grainfield, KS
- 11764.3%Fire
- 1910.4%Rescue & EMS
- 137.1%Hazardous Condition
- 116.0%Service Call
- 84.4%Severe Weather
- 73.8%Good Intent Call
- 63.3%False Alarm
- 10.5%Overpressure Rupture
- Fire incident types reported to NFIRS in Grainfield, KS
- 6555.6%Outside Fires
- 2823.9%Mobile Property/Vehicle Fires
- 2218.8%Structure Fires
- 21.7%Other
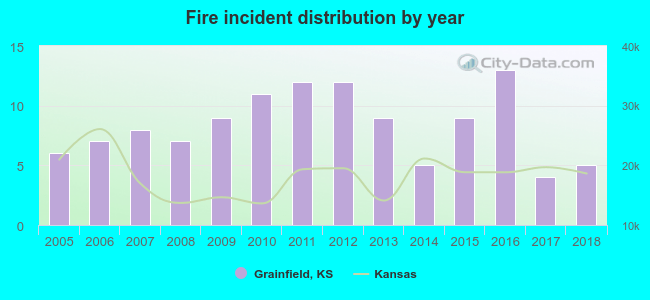 According to the data from the years 2005 - 2018 the average number of fires per year is 8. The highest number of reported fires - 13 took place in 2016, and the least - 4 in 2017. The data has a decreasing trend.
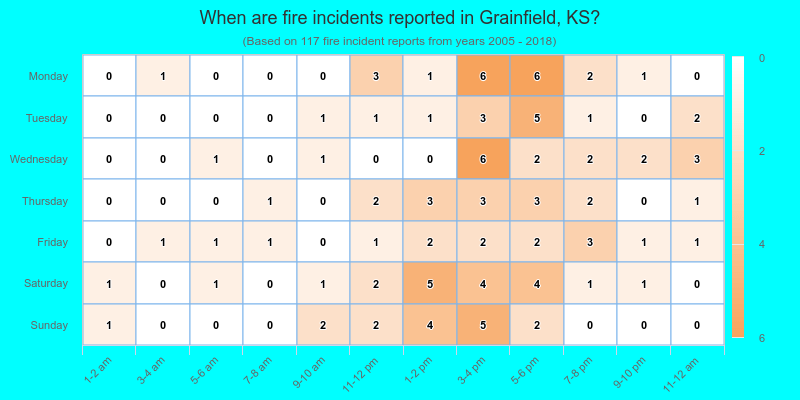
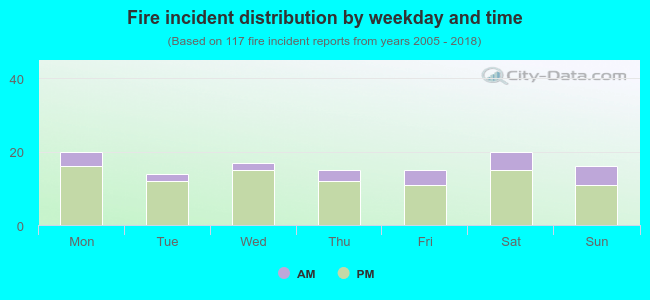 21.4% incidents where reported in the morning and 78.6% in the evening. The most fires (17.1%) took place on Monday, and the least (12.0%) on Tuesday.
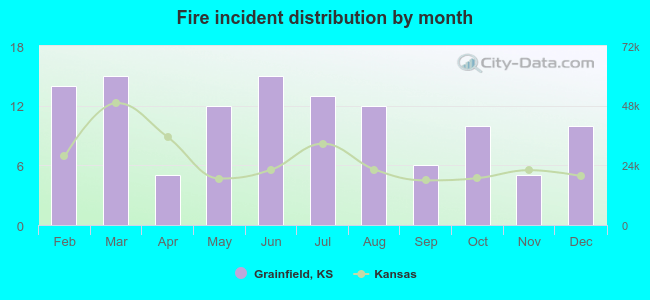 According to the 117 reports from years 2005 - 2018 most fires (12.8%) took place during March, and the least (4.3%) in April.
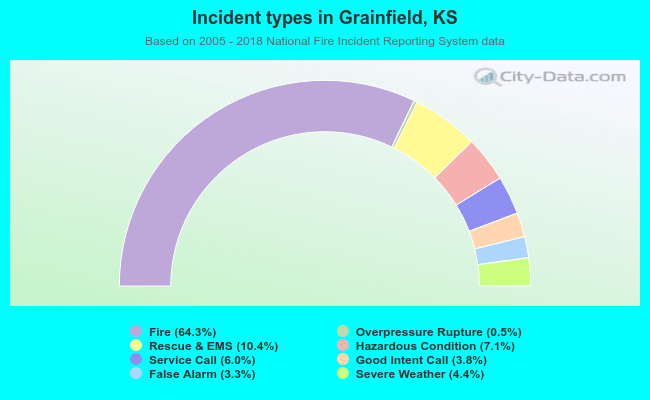 Out of all 182 cases reported during the years 2005 - 2018, the most belonged to the categories: Fire (64.3%), Rescue & EMS (10.4%), and Hazardous Condition (7.1%).
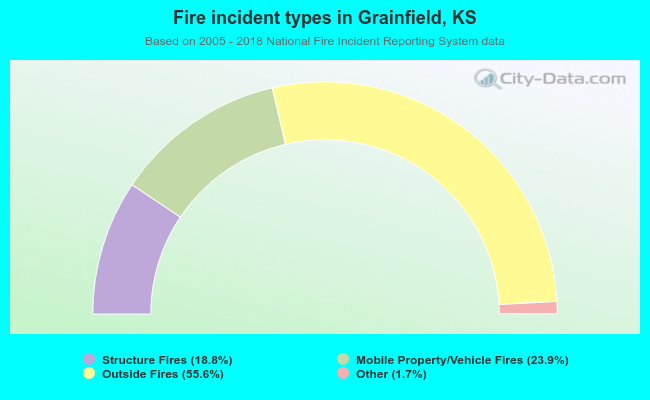 When looking into fire subcategories, the most incidents belonged to: Outside Fires (55.6%), and Mobile Property/Vehicle Fires (23.9%).