Grand Blanc: Fire Incidents, Michigan (MI)
Where are fire incidents reported in Grand Blanc, MI
Something went wrong! Please refresh the page.
| Fire incidents reported | |
|---|---|
| Sreet name | Count |
| SAGINAW ST | 194 |
| GRAND BLANC RD | 122 |
| FENTON RD | 96 |
| HILL RD | 96 |
| BALDWIN RD | 72 |
| COOK RD | 68 |
| PERRY RD | 66 |
| HOLLY RD | 58 |
| DORT HWY | 52 |
| REID RD | 52 |
| TORREY RD | 50 |
| GRAND OAK DR | 48 |
| SAGINAW RD | 44 |
| MAPLEBROOK LN | 40 |
| THORNRIDGE DR | 36 |
| JUNIPER WAY | 34 |
| PORTER RD | 34 |
| EASTKNOLL DR | 28 |
| JUNIPER WAY | 26 |
| KETTERING HTS | 26 |
| MAPLE RD | 22 |
| US 23 NB | 22 |
| FOX HILL DR | 20 |
| BELSAY RD | 16 |
| FOUNTAIN POINTE DR | 16 |
| FOUNTAIN PT | 16 |
| GEORGETOWN RD | 16 |
| GREEN VALLEY DR | 16 |
| LINDEN RD | 16 |
| EMBURY RD | 14 |
| Other | 383 |
2002 - 2018 National Fire Incident Reporting System (NFIRS) incidents
- Incident types reported to NFIRS in Grand Blanc, MI
- 1,79926.2%Fire
- 1,63123.8%Hazardous Condition
- 1,03315.0%Good Intent Call
- 79711.6%Service Call
- 79611.6%Rescue & EMS
- 76811.2%False Alarm
- 220.3%Overpressure Rupture
- 110.2%Special Incident
- 80.1%Severe Weather
- Fire incident types reported to NFIRS in Grand Blanc, MI
- 85547.5%Structure Fires
- 49627.6%Outside Fires
- 37320.7%Mobile Property/Vehicle Fires
- 754.2%Other
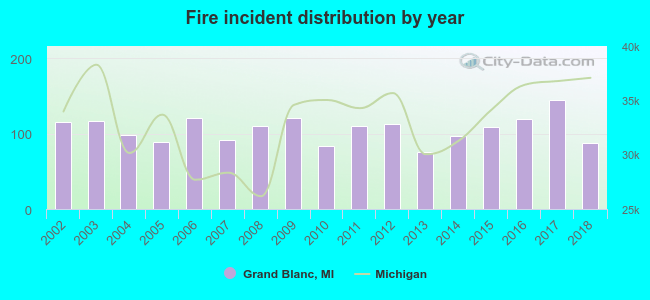 According to the data from the years 2002 - 2018 the average number of fire incidents per year is 106. The highest number of reported fire incidents - 144 took place in 2017, and the least - 76 in 2013. The data has a decreasing trend.
The average number of yearly fire incidents per 10k residents in Grand Blanc, MI compared to nearest cities:
(Note: Based on data for the last 3 years, including only cities with population 5,000 and above)
| Grand Blanc: | 145.6 |
| Burton: | 27.3 |
| Flint: | 89.8 |
| Davison: | 116.7 |
| Holly: | 105.5 |
| Fenton: | 91.6 |
| Swartz Creek: | 131.2 |
| Flushing: | 100.8 |
| Lapeer: | 123.3 |
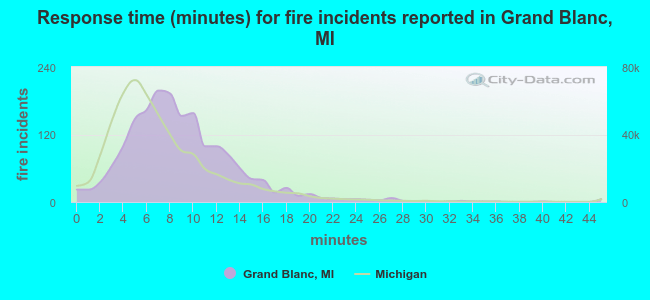 The median response time based on all reported fire incidents is 8 minutes. This is higher than the Michigan median value.
The median response time in Grand Blanc, MI compared to nearest cities:
(Note: Based on data for all years, including only cities with at least 500 fire incidents)
| Grand Blanc: | 8 minutes |
| Burton: | 8 minutes |
| Flint: | 7 minutes |
| Davison: | 8 minutes |
| Holly: | 8 minutes |
| Fenton: | 8 minutes |
| Ortonville: | 7 minutes |
| Swartz Creek: | 9 minutes |
| Linden: | 10 minutes |
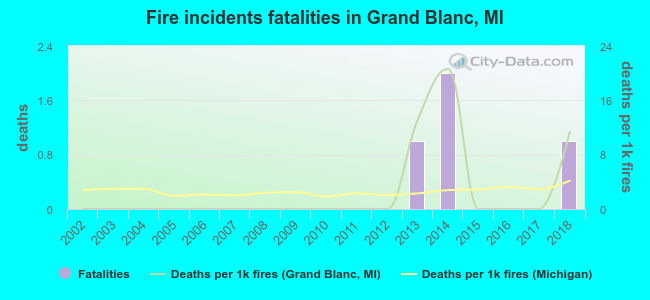 According to the reports from the years 2002 - 2018 the average number of fire-related fatalities per year is 0. The highest number of reported deaths - 2 took place in 2014, and the lowest - 0 in 2002. The data has a rising trend.
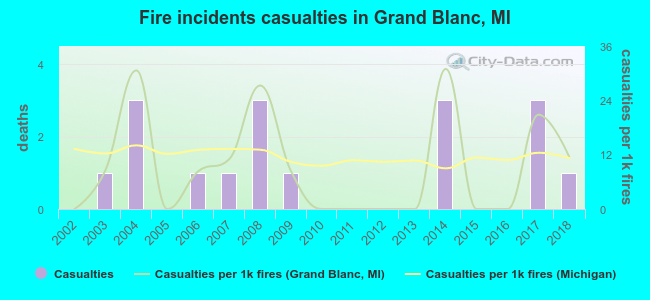 According to the data from the years 2002 - 2018 the average number of fire-related casualties per year is 1. The highest number of casualties - 3 took place in 2004, and the lowest - 0 in 2002. The data has a rising trend.
The average number of injuries per 1,000 fires is 9. This indicator was the highest - 31 in 2014, and the lowest 0 in 2002. The trend for injuries per 1,000 incidents is growing. Compared to the state value the number of casualties per 1,000 incidents is lower.
According to the data from the years 2002 - 2018 the average number of fire-related casualties per year is 1. The highest number of casualties - 3 took place in 2004, and the lowest - 0 in 2002. The data has a rising trend.
The average number of injuries per 1,000 fires is 9. This indicator was the highest - 31 in 2014, and the lowest 0 in 2002. The trend for injuries per 1,000 incidents is growing. Compared to the state value the number of casualties per 1,000 incidents is lower.Casualties per 1,000 incidents in Grand Blanc, MI compared to nearest cities:
(Note: Based on data for all years, including only cities with at least 500 fire incidents)
| Grand Blanc: | 9.4 |
| Burton: | 29.0 |
| Flint: | 13.8 |
| Davison: | 19.4 |
| Holly: | 7.2 |
| Fenton: | 2.8 |
| Ortonville: | 14.2 |
| Swartz Creek: | 4.3 |
| Linden: | 1.2 |
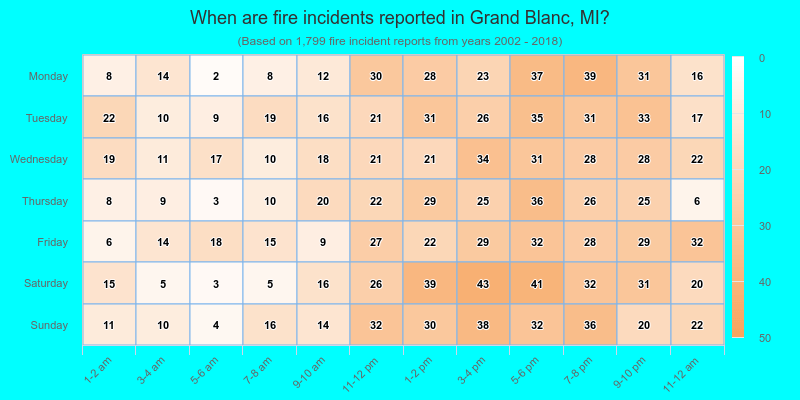
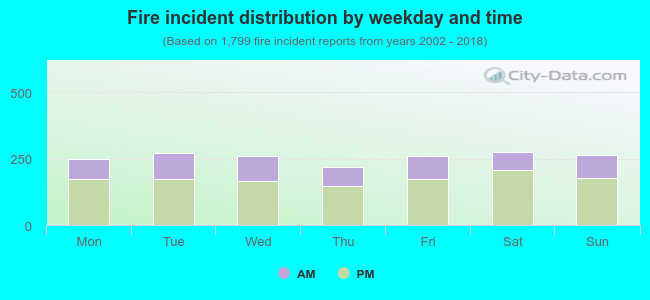 32.5% incidents where reported in the morning and 67.5% in the evening. The most fires (15.3%) took place on Saturday, and the least (12.2%) on Thursday.
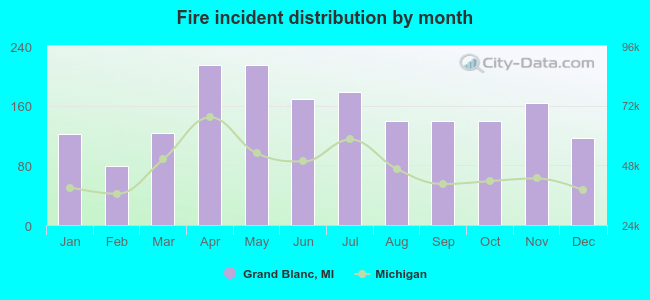 According to the 1,799 reports from years 2002 - 2018 most fires (12.0%) took place during April, and the least (4.4%) in February.
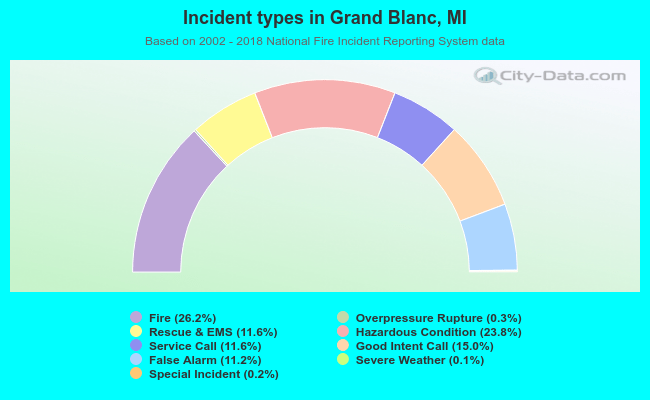 Out of all 6,865 cases reported during the years 2002 - 2018, the most belonged to the categories: Fire (26.2%), Hazardous Condition (23.8%), and Good Intent Call (15.0%).
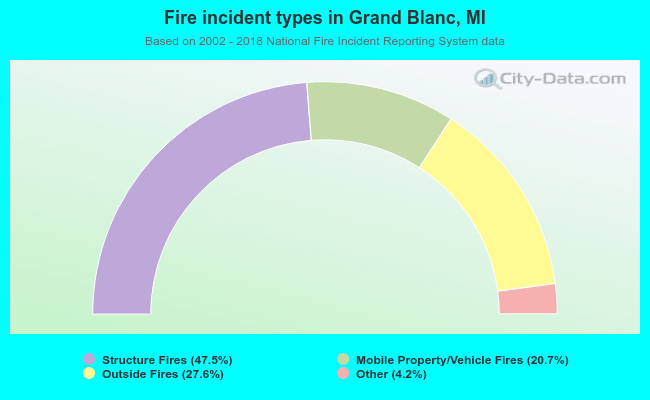 When looking into fire subcategories, the most reports belonged to: Structure Fires (47.5%), and Outside Fires (27.6%).