Grand Saline: Fire Incidents, Texas (TX)
Where are fire incidents reported in Grand Saline, TX
Something went wrong! Please refresh the page.
|
| |||||||||||||||||||||||||||||||||||||||||||||||||||||||||||||||||||||||||||||||||||||||||||||||||||||||||||||
| Other | 77 | |||||||||||||||||||||||||||||||||||||||||||||||||||||||||||||||||||||||||||||||||||||||||||||||||||||||||||||
2002 - 2018 National Fire Incident Reporting System (NFIRS) incidents
- Incident types reported to NFIRS in Grand Saline, TX
- 90542.1%Fire
- 71133.1%Hazardous Condition
- 21610.0%Rescue & EMS
- 1617.5%Good Intent Call
- 723.3%Service Call
- 381.8%False Alarm
- 231.1%Special Incident
- 200.9%Severe Weather
- 40.2%Overpressure Rupture
- Fire incident types reported to NFIRS in Grand Saline, TX
- 59365.5%Outside Fires
- 18820.8%Structure Fires
- 909.9%Mobile Property/Vehicle Fires
- 343.8%Other
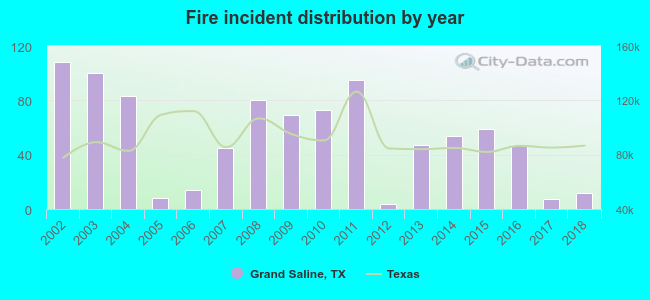 Based on the data from the years 2002 - 2018 the average number of fires per year is 53. The highest number of fire incidents - 108 took place in 2002, and the least - 4 in 2012. The data has a decreasing trend.
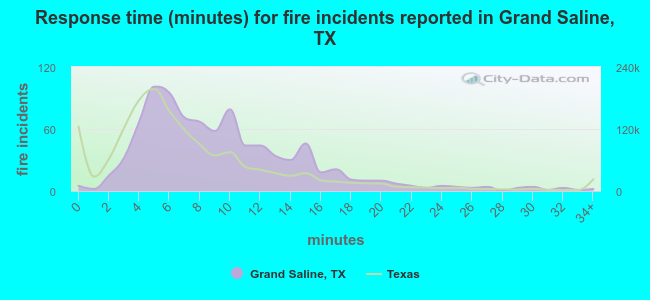 The median response time based on all reported fire incidents is 8 minutes. This is higher than the Texas median value.
The median response time in Grand Saline, TX compared to nearest cities:
(Note: Based on data for all years, including only cities with at least 500 fire incidents)
| Grand Saline: | 8 minutes |
| Van: | 10 minutes |
| Canton: | 10 minutes |
| Mineola: | 11 minutes |
| Emory: | 8 minutes |
| Wills Point: | 10 minutes |
| Quitman: | 9 minutes |
| Yantis: | 6 minutes |
| Lindale: | 11 minutes |
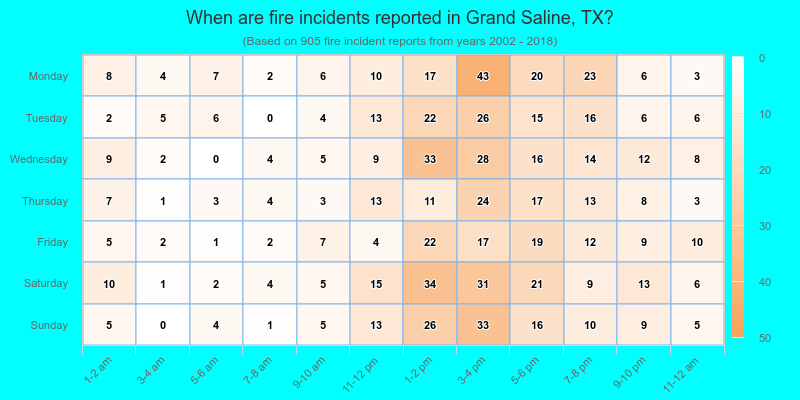
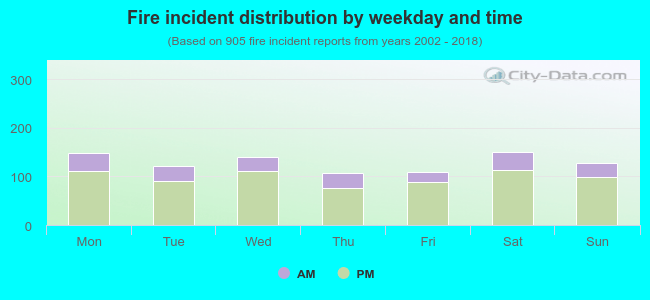 23.5% incidents where reported in the morning and 76.5% in the evening. The most fires (16.7%) took place on Saturday, and the least (11.8%) on Thursday.
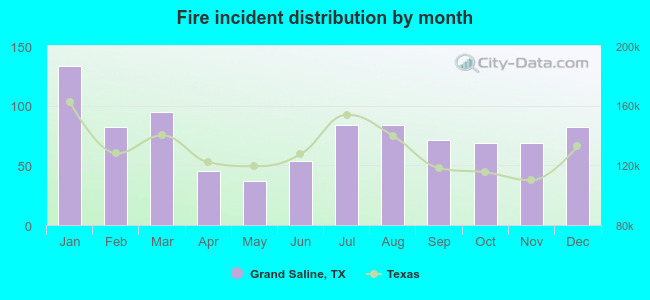 Based on the 905 reports from years 2002 - 2018 most fires (14.7%) took place during January, and the least (4.1%) in May.
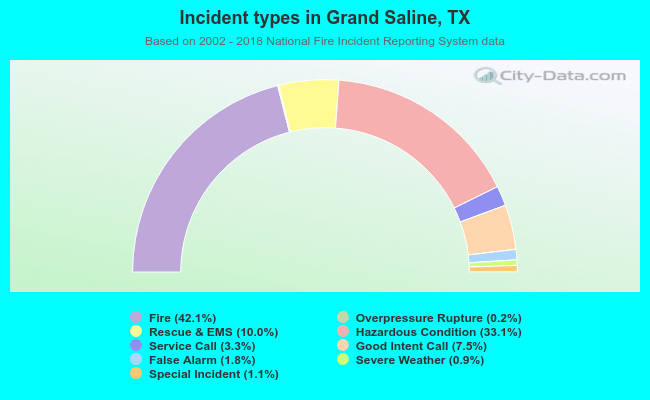 Out of all 2,150 cases reported during the years 2002 - 2018, the most belonged to the categories: Fire (42.1%), Hazardous Condition (33.1%), and Rescue & EMS (10.0%).
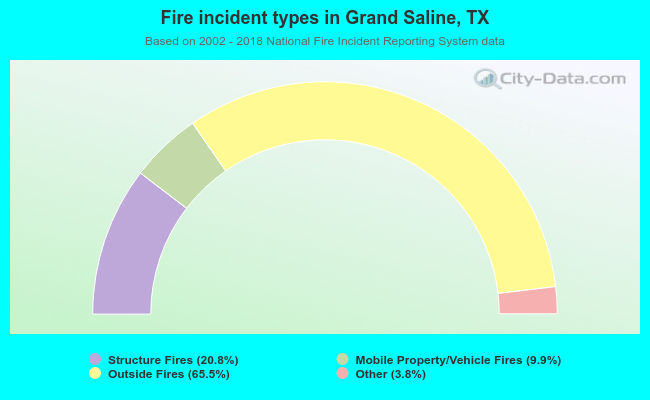 When looking into fire subcategories, the most incidents belonged to: Outside Fires (65.5%), and Structure Fires (20.8%).