Granville: Fire Incidents, Massachusetts (MA)
Where are fire incidents reported in Granville, MA
Something went wrong! Please refresh the page.
|
| |||||||||||||||||||||||||||||||||||||||||||||||||||||||||||||||||||||||||||||||||||||||||||||||||||||||||||||
2002 - 2018 National Fire Incident Reporting System (NFIRS) incidents
- Incident types reported to NFIRS in Granville, MA
- 44150.1%Rescue & EMS
- 17119.4%Fire
- 11513.1%Hazardous Condition
- 546.1%False Alarm
- 485.5%Good Intent Call
- 475.3%Service Call
- 40.5%Special Incident
- Fire incident types reported to NFIRS in Granville, MA
- 9555.6%Structure Fires
- 3621.1%Outside Fires
- 2615.2%Other
- 148.2%Mobile Property/Vehicle Fires
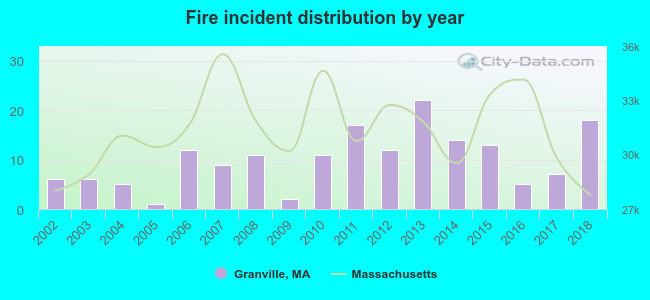 According to the data from the years 2002 - 2018 the average number of fire incidents per year is 10. The highest number of reported fire incidents - 22 took place in 2013, and the least - 1 in 2005. The data has a growing trend.
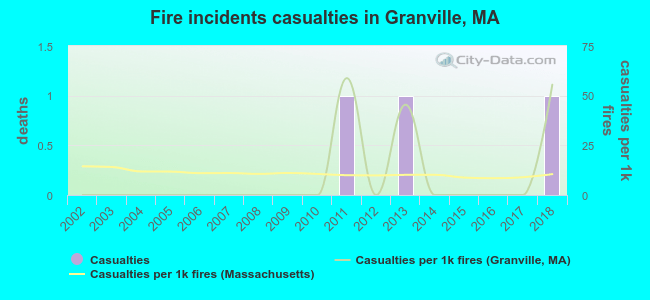 Based on the data from the years 2002 - 2018 the average number of fire-related yearly casualties is 0. The highest number of casualties - 1 took place in 2011, and the lowest - 0 in 2002. The data has a growing trend.
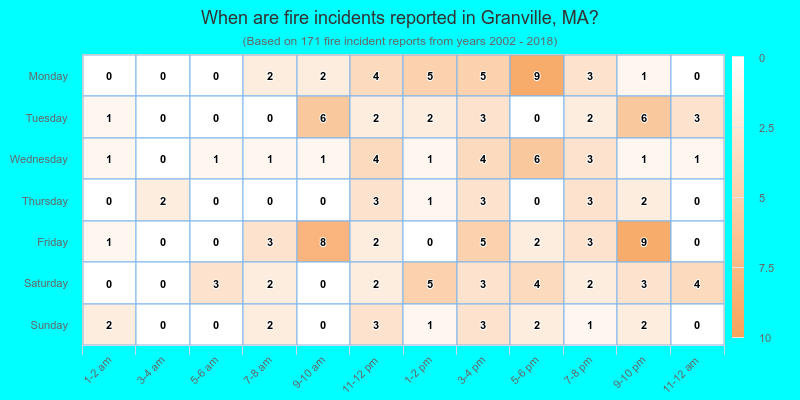
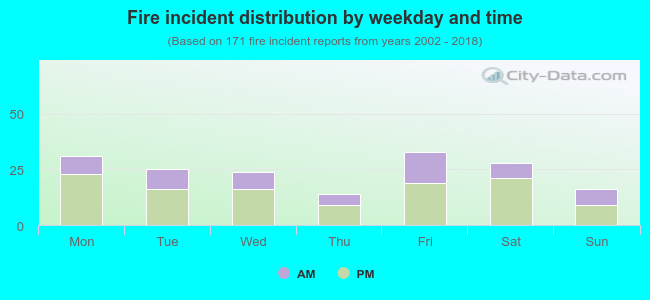 33.9% incidents where reported in the morning and 66.1% in the evening. The most fires (19.3%) took place on Friday, and the least (8.2%) on Thursday.
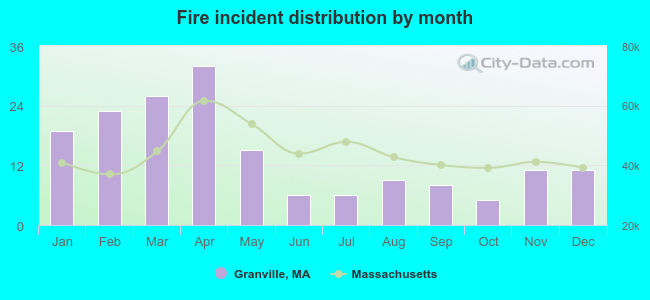 According to the 171 fire incidents from years 2002 - 2018 most fires (18.7%) took place during April, and the least (2.9%) in October.
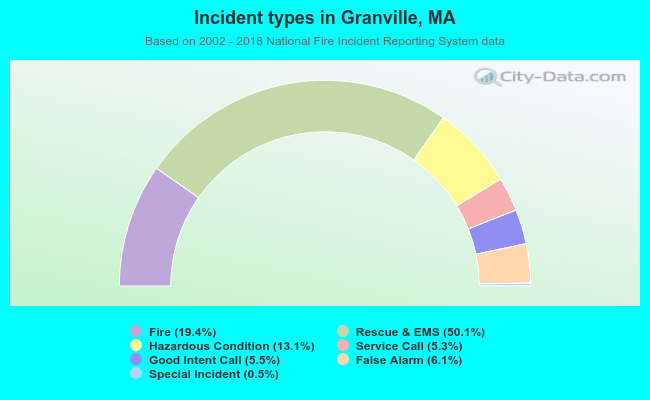 Out of all 880 cases reported during the years 2002 - 2018, the most belonged to the categories: Overpressure Rupture (50.1%), Fire (19.4%), and Rescue & EMS (13.1%).
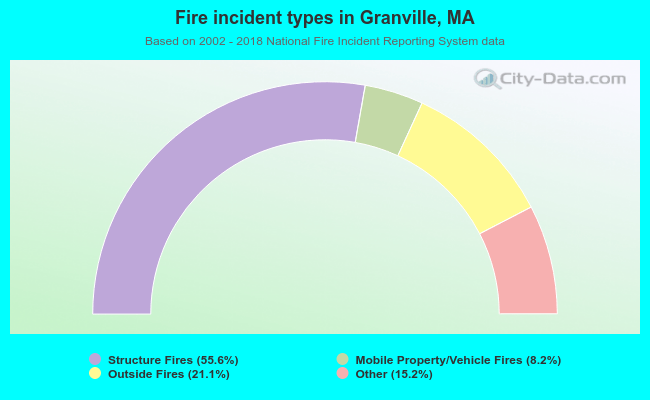 When looking into fire subcategories, the most reports belonged to: Structure Fires (55.6%), and Outside Fires (21.1%).