Greenacres: Fire Incidents, California (CA)
Where are fire incidents reported in Greenacres, CA
Something went wrong! Please refresh the page.
|
| |||||||||||||||||||||||||||||||||||||||||||||||||||||||||||||||||||||||||||||||||||||||||||||||||||||||||||||
2005 - 2018 National Fire Incident Reporting System (NFIRS) incidents
- Incident types reported to NFIRS in Greenacres, CA
- 67747.6%Rescue & EMS
- 18913.3%Hazardous Condition
- 17512.3%Good Intent Call
- 15510.9%Fire
- 1389.7%Service Call
- 443.1%False Alarm
- 342.4%Special Incident
- 90.6%Overpressure Rupture
- Fire incident types reported to NFIRS in Greenacres, CA
- 6340.6%Structure Fires
- 5434.8%Outside Fires
- 3522.6%Mobile Property/Vehicle Fires
- 31.9%Other
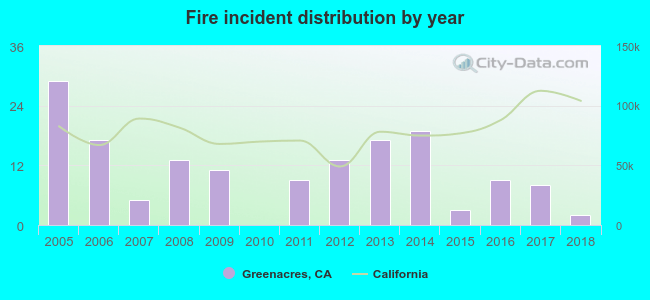 According to the data from the years 2005 - 2018 the average number of fires per year is 11. The highest number of fires - 29 took place in 2005, and the least - 0 in 2010. The data has a declining trend.
The average number of yearly fire incidents per 10k residents in Greenacres, CA compared to nearest cities:
(Note: Based on data for the last 3 years, including only cities with population 5,000 and above)
| Greenacres: | 11.4 |
| Bakersfield: | 64.4 |
| Rosedale: | 1.1 |
| Oildale: | 38.1 |
| Shafter: | 34.7 |
| Lamont: | 28.2 |
| Wasco: | 30.0 |
| Arvin: | 37.7 |
| McFarland: | 32.1 |
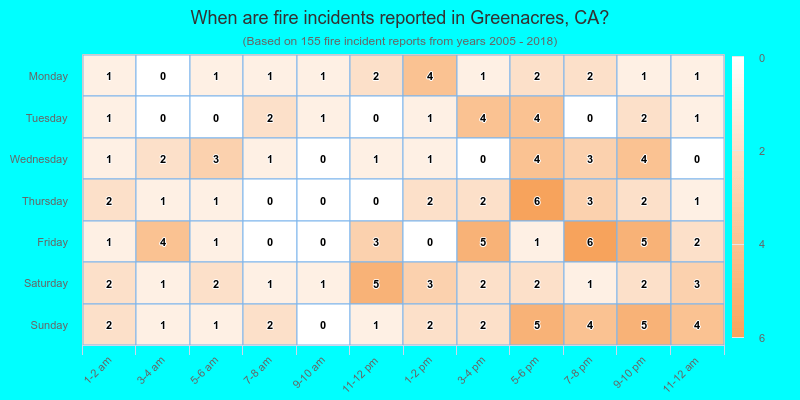
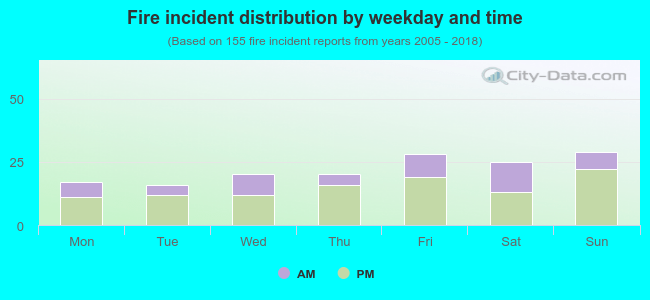 32.3% incidents where reported in the morning and 67.7% in the evening. The most fires (18.7%) took place on Sunday, and the least (10.3%) on Tuesday.
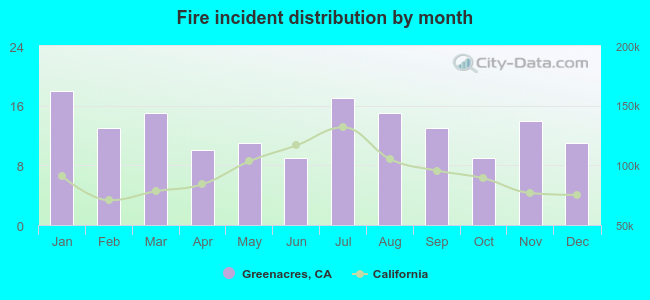 According to the 155 fires from years 2005 - 2018 most fires (11.6%) took place during January, and the least (5.8%) in June.
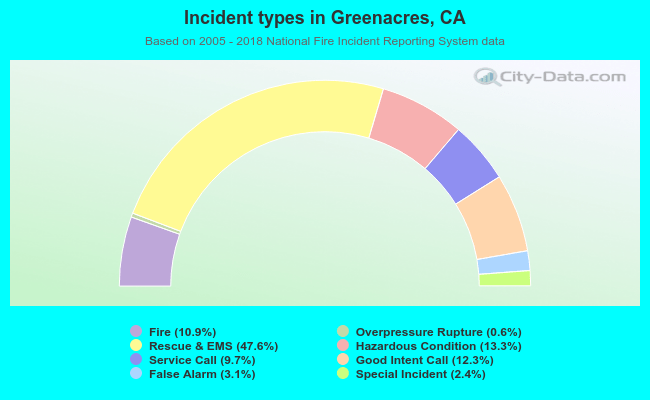 Out of all 1,421 cases reported during the years 2005 - 2018, the most belonged to the categories: Rescue & EMS (47.6%), Hazardous Condition (13.3%), and Good Intent Call (12.3%).
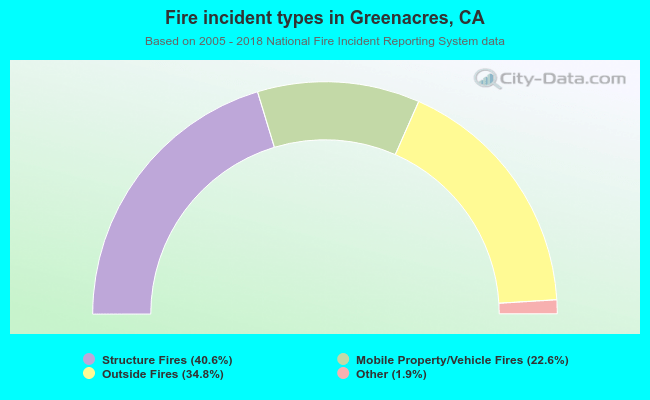 When looking into fire subcategories, the most incidents belonged to: Structure Fires (40.6%), and Outside Fires (34.8%).