Hadley: Fire Incidents, Massachusetts (MA)
Where are fire incidents reported in Hadley, MA
Something went wrong! Please refresh the page.
|
| |||||||||||||||||||||||||||||||||||||||||||||||||||||||||||||||||||||||||||||||||||||||||||||||||||||||||||||
2002 - 2018 National Fire Incident Reporting System (NFIRS) incidents
- Incident types reported to NFIRS in Hadley, MA
- 62258.5%Rescue & EMS
- 19518.3%Fire
- 12211.5%False Alarm
- 423.9%Hazardous Condition
- 363.4%Service Call
- 353.3%Good Intent Call
- 60.6%Overpressure Rupture
- 50.5%Severe Weather
- Fire incident types reported to NFIRS in Hadley, MA
- 11659.5%Structure Fires
- 3216.4%Mobile Property/Vehicle Fires
- 2512.8%Outside Fires
- 2211.3%Other
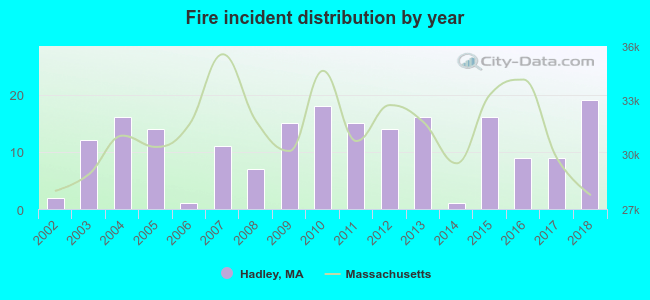 Based on the data from the years 2002 - 2018 the average number of fire incidents per year is 11. The highest number of reported fires - 19 took place in 2018, and the least - 1 in 2006. The data has a growing trend.
The average number of yearly fire incidents per 10k residents in Hadley, MA compared to nearest cities:
(Note: Based on data for the last 3 years, including only cities with population 5,000 and above)
| Hadley: | 23.5 |
| Amherst: | 19.9 |
| Northampton: | 16.5 |
| Easthampton: | 27.6 |
| South Hadley: | 42.3 |
| Holyoke: | 90.1 |
| Deerfield: | 20.2 |
| Southampton: | 41.4 |
| Chicopee: | 33.0 |
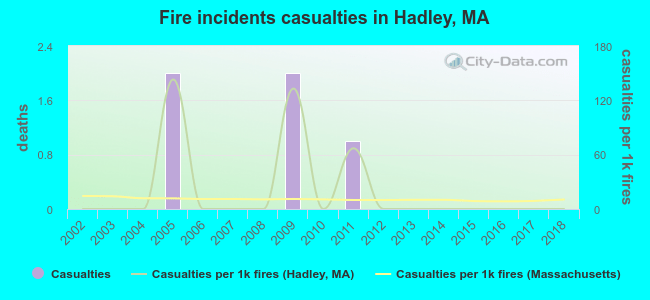 Based on the data from the years 2002 - 2018 the average number of fire-related yearly casualties is 0. The highest number of reported injuries - 2 took place in 2005, and the lowest - 0 in 2002. The data has a constant trend.
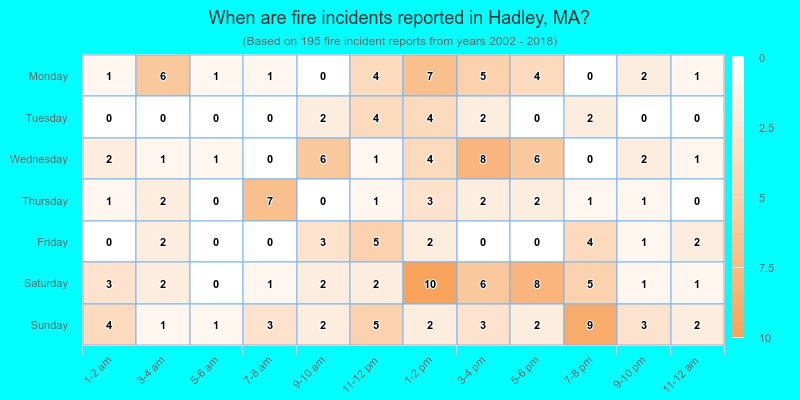
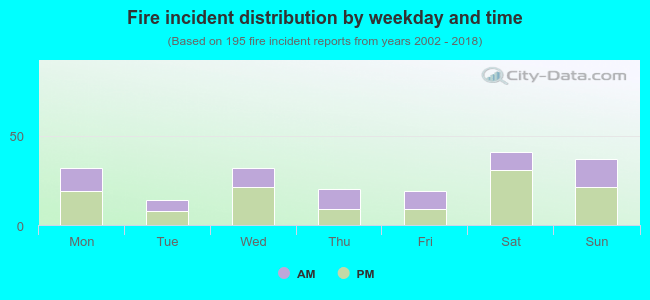 39.5% incidents where reported in the morning and 60.5% in the evening. The most fires (21.0%) took place on Saturday, and the least (7.2%) on Tuesday.
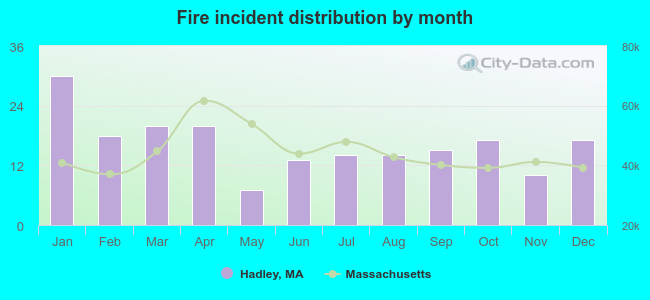 Based on the 195 reports from years 2002 - 2018 most fires (15.4%) took place during January, and the least (3.6%) in May.
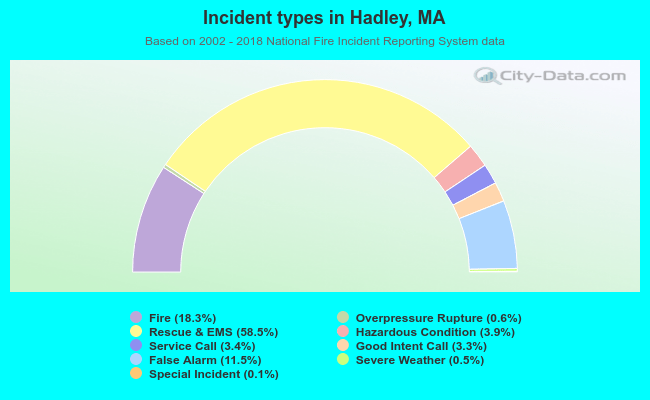 Out of all 1,064 cases reported during the years 2002 - 2018, the most belonged to the categories: Rescue & EMS (58.5%), Fire (18.3%), and False Alarm (11.5%).
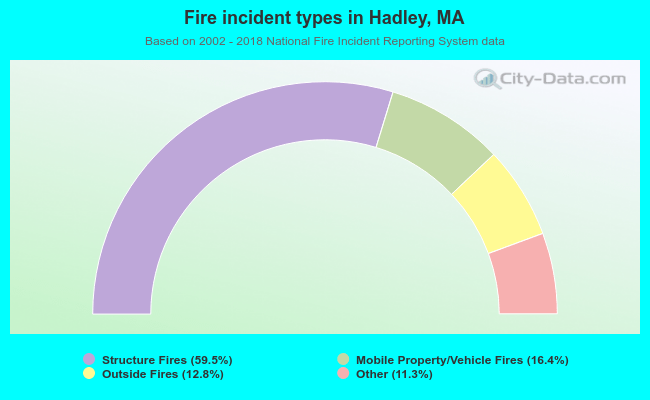 When looking into fire subcategories, the most incidents belonged to: Structure Fires (59.5%), and Mobile Property/Vehicle Fires (16.4%).