Hamlet: Fire Incidents, North Carolina (NC)
Where are fire incidents reported in Hamlet, NC
Something went wrong! Please refresh the page.
|
| |||||||||||||||||||||||||||||||||||||||||||||||||||||||||||||||||||||||||||||||||||||||||||||||||||||||||||||
| Other | 57 | |||||||||||||||||||||||||||||||||||||||||||||||||||||||||||||||||||||||||||||||||||||||||||||||||||||||||||||
2004 - 2018 National Fire Incident Reporting System (NFIRS) incidents
- Incident types reported to NFIRS in Hamlet, NC
- 82345.2%Fire
- 28515.7%Rescue & EMS
- 23613.0%Hazardous Condition
- 22712.5%False Alarm
- 20511.3%Good Intent Call
- 372.0%Service Call
- 40.2%Severe Weather
- Fire incident types reported to NFIRS in Hamlet, NC
- 44253.7%Outside Fires
- 28634.8%Structure Fires
- 8410.2%Mobile Property/Vehicle Fires
- 111.3%Other
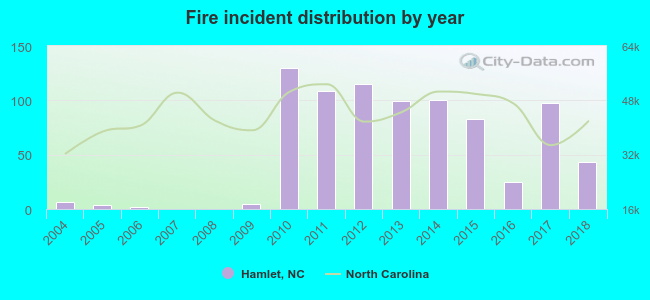 According to the data from the years 2004 - 2018 the average number of fires per year is 55. The highest number of fires - 130 took place in 2010, and the least - 0 in 2007. The data has a growing trend.
The average number of yearly fire incidents per 10k residents in Hamlet, NC compared to nearest cities:
(Note: Based on data for the last 3 years, including only cities with population 5,000 and above)
| Hamlet: | 85.0 |
| Rockingham: | 119.3 |
| Laurinburg: | 99.6 |
| Wadesboro: | 86.0 |
| Aberdeen: | 178.1 |
| Pinehurst: | 47.3 |
| Southern Pines: | 88.4 |
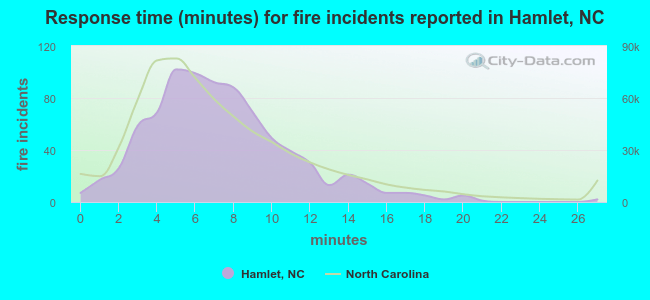 The median response time based on all reported fire incidents is 7 minutes. This is close to the state median value.
The median response time in Hamlet, NC compared to nearest cities:
(Note: Based on data for all years, including only cities with at least 500 fire incidents)
| Hamlet: | 7 minutes |
| Rockingham: | 6 minutes |
| Laurinburg: | 5 minutes |
| Pinebluff: | 8 minutes |
| Wadesboro: | 5 minutes |
| Maxton: | 12 minutes |
| Aberdeen: | 5 minutes |
| Pinehurst: | 6 minutes |
| Southern Pines: | 5 minutes |
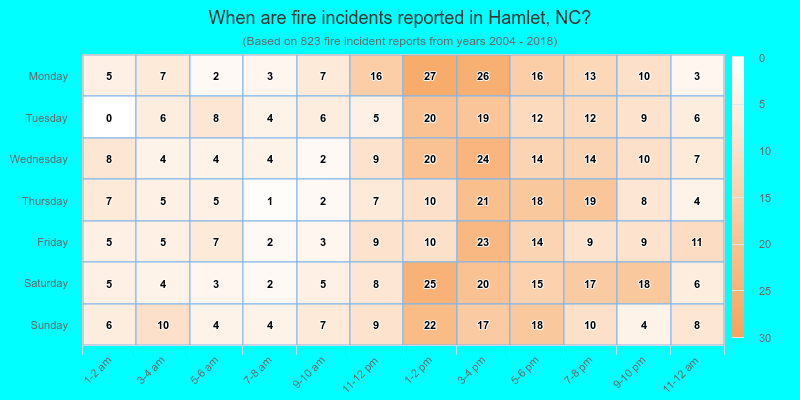
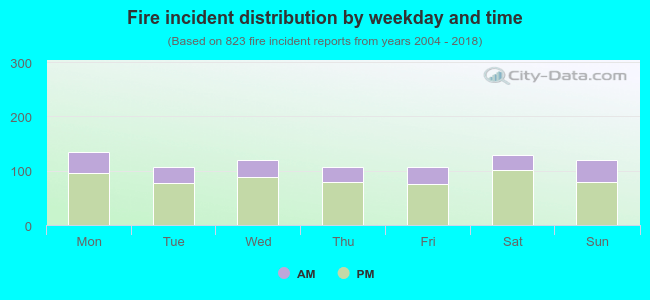 27.3% incidents where reported in the morning and 72.7% in the evening. The most fires (16.4%) took place on Monday, and the least (13.0%) on Tuesday.
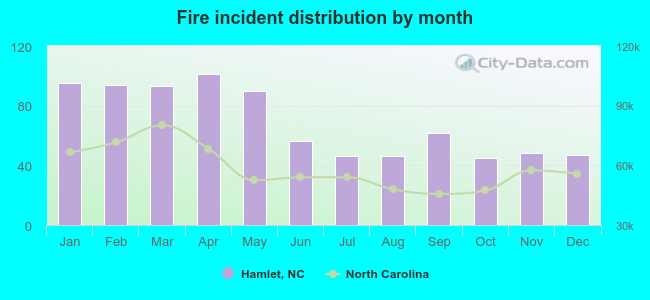 According to the 823 reports from years 2004 - 2018 most fires (12.3%) took place during April, and the least (5.5%) in October.
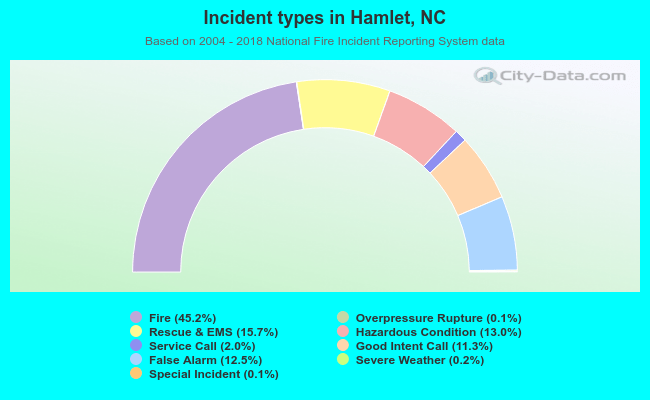 Out of all 1,819 cases reported during the years 2004 - 2018, the most belonged to the categories: Fire (45.2%), Rescue & EMS (15.7%), and Hazardous Condition (13.0%).
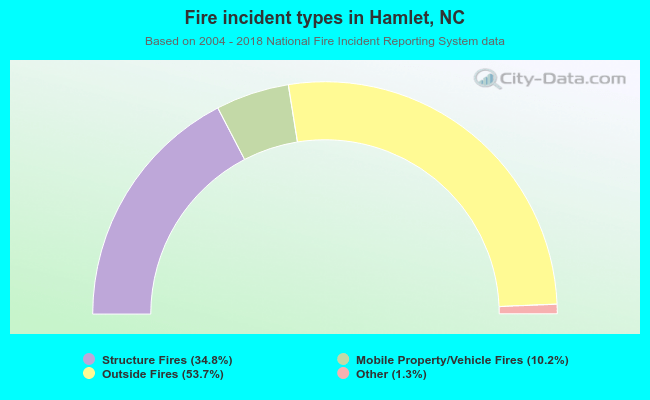 When looking into fire subcategories, the most reports belonged to: Outside Fires (53.7%), and Structure Fires (34.8%).