Hamlin: Fire Incidents, Texas (TX)
Where are fire incidents reported in Hamlin, TX
Something went wrong! Please refresh the page.
|
| |||||||||||||||||||||||||||||||||||||||||||||||||||||||||||||||||||||||||||||||||||||||||||||||||||||||||||||
| Other | 91 | |||||||||||||||||||||||||||||||||||||||||||||||||||||||||||||||||||||||||||||||||||||||||||||||||||||||||||||
2003 - 2011 National Fire Incident Reporting System (NFIRS) incidents
- Incident types reported to NFIRS in Hamlin, TX
- 30585.0%Fire
- 349.5%Hazardous Condition
- 71.9%Service Call
- 51.4%Rescue & EMS
- 51.4%Good Intent Call
- 30.8%Severe Weather
- Fire incident types reported to NFIRS in Hamlin, TX
- 22874.8%Outside Fires
- 4213.8%Structure Fires
- 237.5%Mobile Property/Vehicle Fires
- 123.9%Other
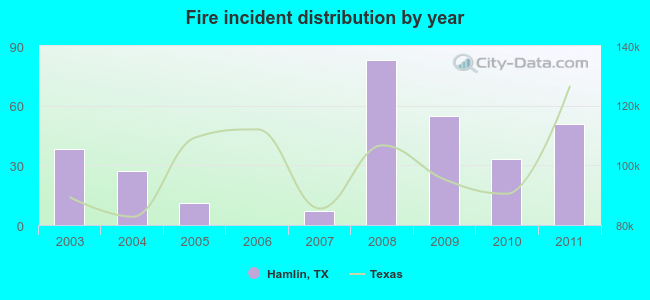 According to the data from the years 2003 - 2011 the average number of fires per year is 34. The highest number of fire incidents - 83 took place in 2008, and the least - 0 in 2006. The data has an increasing trend.
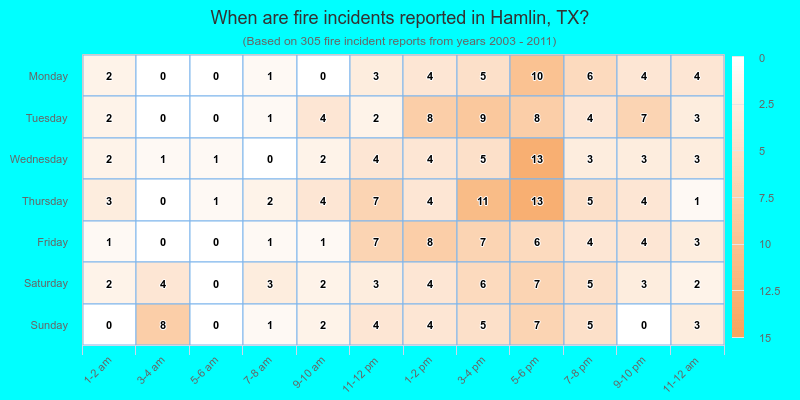
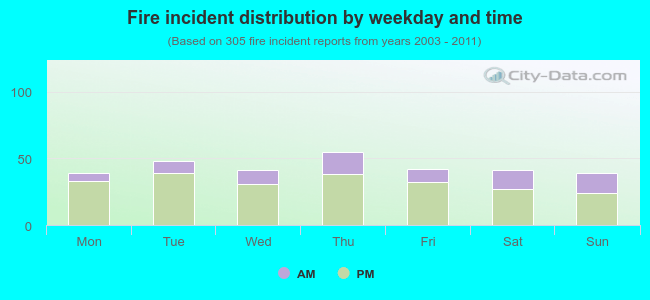 26.6% incidents where reported in the morning and 73.4% in the evening. The most fires (18.0%) took place on Thursday, and the least (12.8%) on Monday.
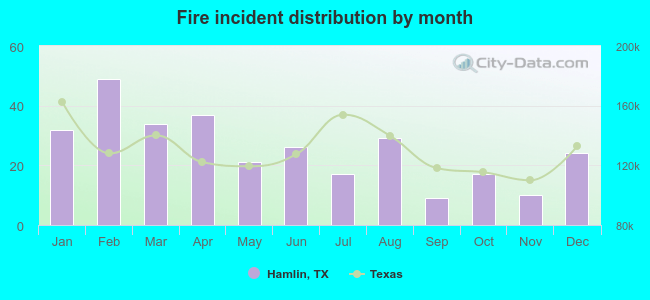 According to the 305 fire incident reports from years 2003 - 2011 most fires (16.1%) took place during February, and the least (3.0%) in September.
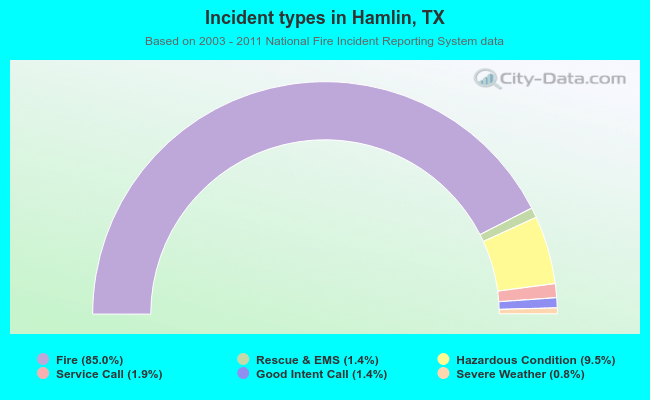 Out of all 359 cases reported during the years 2003 - 2011, the most belonged to the categories: Fire (85.0%), Rescue & EMS (9.5%), and Hazardous Condition (1.9%).
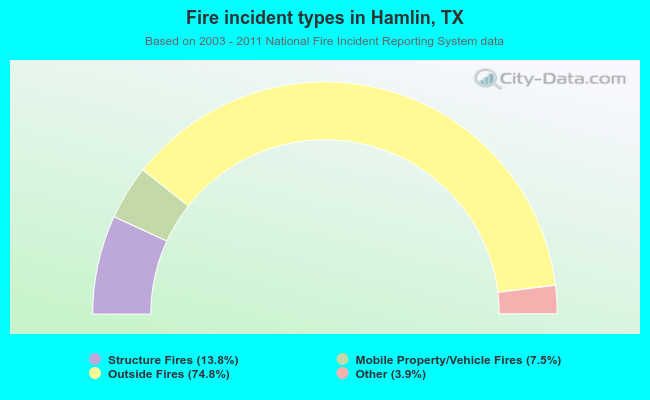 When looking into fire subcategories, the most reports belonged to: Outside Fires (74.8%), and Structure Fires (13.8%).