| Fire incidents reported |
|---|
| Sreet name | Count |
|---|
| NEW BETHEL RD | 10 | | STATE ROAD 256 | 10 | | WEST ST | 10 | | GRANGE HALL RD | 8 | | LAGRANGE RD | 8 | | MAIN CROSS | 8 | | SR 56 HWY | 6 | | STATE ROAD 56 | 6 | | STATE ROAD 56 WEST | 6 | | STATE ROAD 62 | 6 | | STATE ROAD 62 SOUTH | 6 | | 132 MAPLE ST | 4 | | GREENBRIAR RD | 4 | | HICKORY DRIVE | 4 | | JACKSON RD | 4 | | MAIN ST | 4 | | MAPLE ST | 4 | | RIVERVIEW DR | 4 | | SR 56 | 4 | | STATE RD 62 | 4 | | TEN CENT RD | 4 | | WARMAN RD | 4 | | WEST STREET | 4 | | 115 SOUTH SYCAMORE | 2 | | 12 VOLTZ DR | 2 |
| | | Fire incidents reported |
|---|
| Sreet name | Count |
|---|
| 146 HICKORY DRIVE | 2 | | 154 WEST MAIN HANOVER | 2 | | 204 MAPLE ST. | 2 | | 204 MAPLE STREET | 2 | | 205 VOLZ DR | 2 | | 207 MAPLE | 2 | | 225 MEADOW LANE | 2 | | 254 THORNTON ROAD | 2 | | 261 NOVEMBER STREET | 2 | | 32 MADISON AV. | 2 | | 327 NOVEMBER ST | 2 | | 3317 W PROSPECT RD | 2 | | 3457 WEST TEN CENT ROAD | 2 | | 3924 ST. RD 56 | 2 | | 3924 WEST ST RD ??62 | 2 | | 3925 W SR 56 | 2 | | 400 | 2 | | 400 SOUTH | 2 | | 4310 S HUTCH LANE | 2 | | 44 WEST ST LOT 160 | 2 | | 44 WEST ST LOT 19 | 2 | | 44 WEST ST LOT 29 | 2 | | 44 WEST STREET LOT 8 | 2 | | 444 GREENBRAIR ROAD | 2 | | |
|
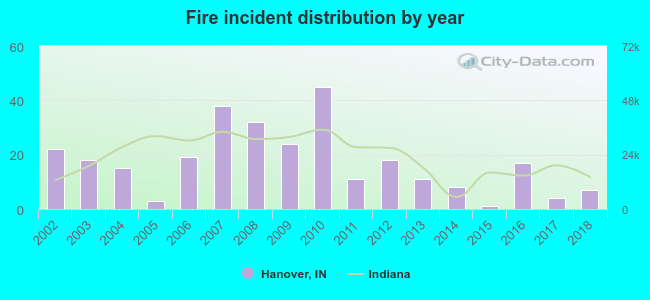 According to the data from the years 2002 - 2018 the average number of fires per year is 17. The highest number of reported fires - 45 took place in 2010, and the least - 1 in 2015. The data has a declining trend.
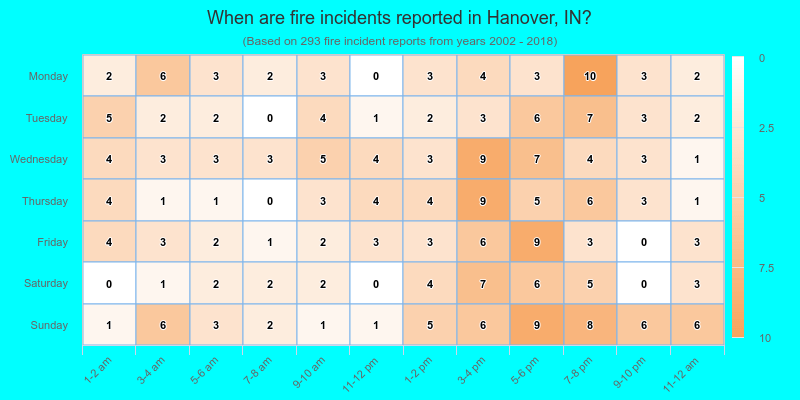
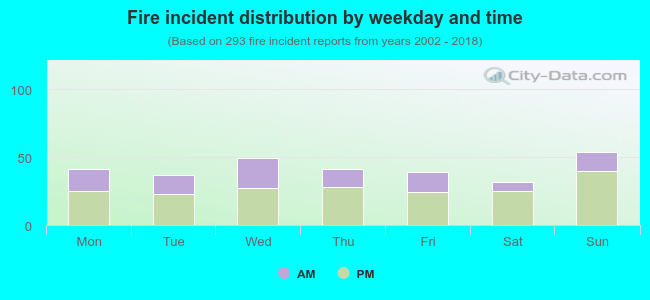 34.5% incidents where reported in the morning and 65.5% in the evening. The most fires (18.4%) took place on Sunday, and the least (10.9%) on Saturday.
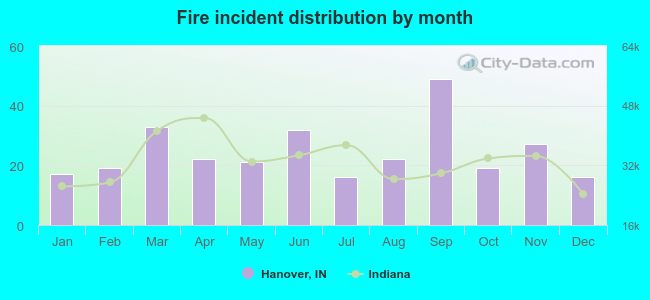 Based on the 293 reports from years 2002 - 2018 most fires (16.7%) took place during September, and the least (5.5%) in July.
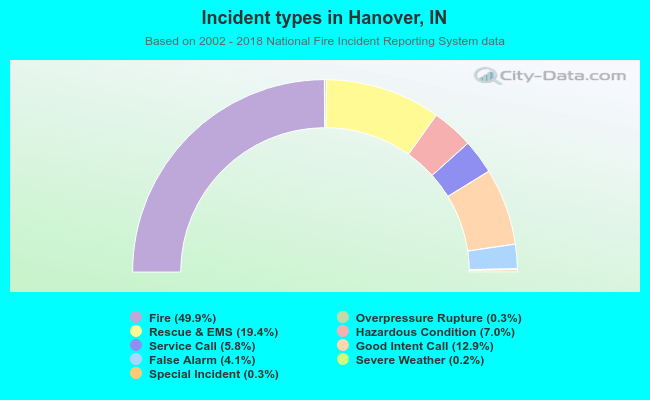 Out of all 587 cases reported during the years 2002 - 2018, the most belonged to the categories: Fire (49.9%), Rescue & EMS (19.4%), and Good Intent Call (12.9%).
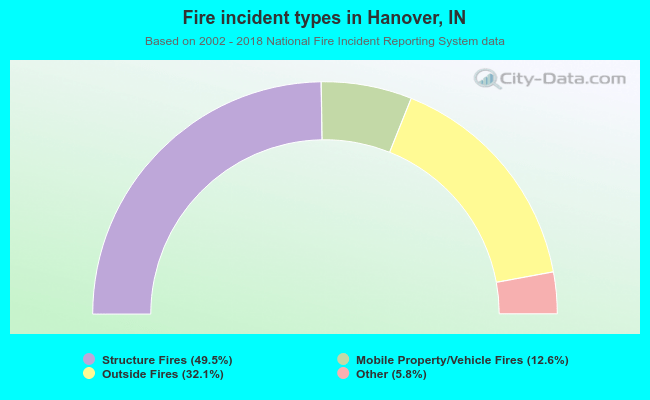 When looking into fire subcategories, the most reports belonged to: Structure Fires (49.5%), and Outside Fires (32.1%).