Harper: Fire Incidents, Texas (TX)
Where are fire incidents reported in Harper, TX
Something went wrong! Please refresh the page.
|
| |||||||||||||||||||||||||||||||||||||||||||||||||||||||||||||||||||||||||||||||||||||||||||||||||||||||||||||
| Other | 172 | |||||||||||||||||||||||||||||||||||||||||||||||||||||||||||||||||||||||||||||||||||||||||||||||||||||||||||||
2003 - 2018 National Fire Incident Reporting System (NFIRS) incidents
- Incident types reported to NFIRS in Harper, TX
- 39855.8%Fire
- 20929.3%Rescue & EMS
- 7210.1%Good Intent Call
- 223.1%Hazardous Condition
- 91.3%Service Call
- 20.3%False Alarm
- 10.1%Special Incident
- Fire incident types reported to NFIRS in Harper, TX
- 29273.4%Outside Fires
- 7518.8%Structure Fires
- 205.0%Mobile Property/Vehicle Fires
- 112.8%Other
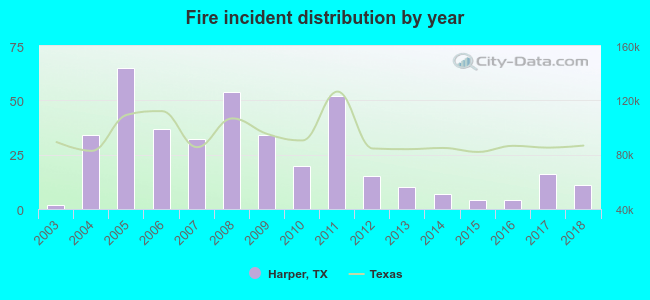 According to the data from the years 2003 - 2018 the average number of fires per year is 25. The highest number of fire incidents - 65 took place in 2005, and the least - 2 in 2003. The data has an increasing trend.
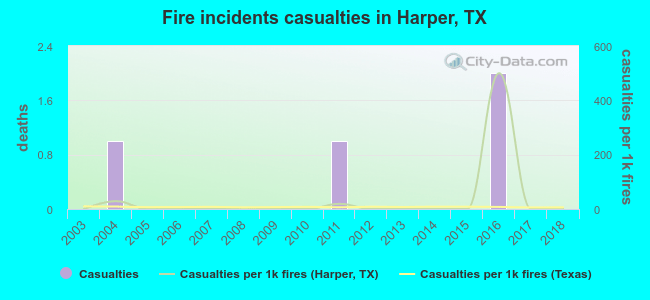 Based on the reports from the years 2003 - 2018 the average number of fire-related yearly casualties is 0. The highest number of injuries - 2 took place in 2016, and the lowest - 0 in 2003. The data has a constant trend.
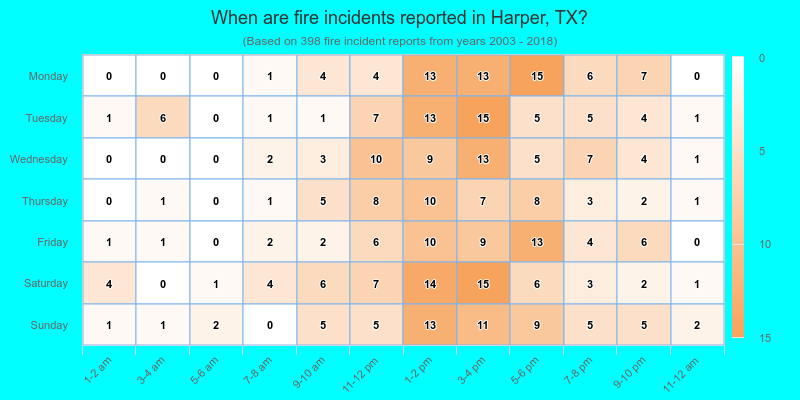
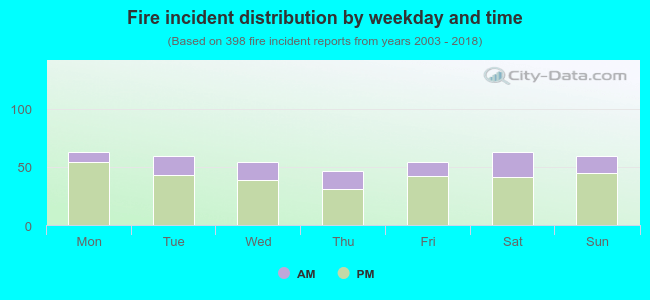 25.9% incidents where reported in the morning and 74.1% in the evening. The most fires (15.8%) took place on Monday, and the least (11.6%) on Thursday.
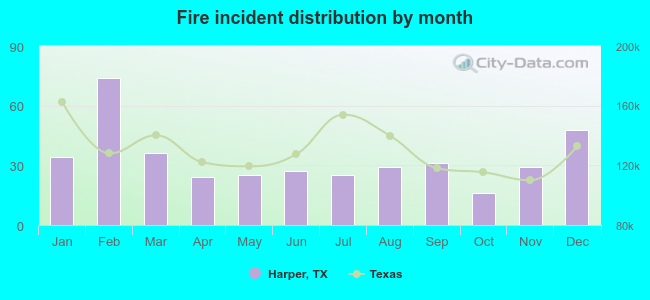 According to the 398 fire incident reports from years 2003 - 2018 most fires (18.6%) took place during February, and the least (4.0%) in October.
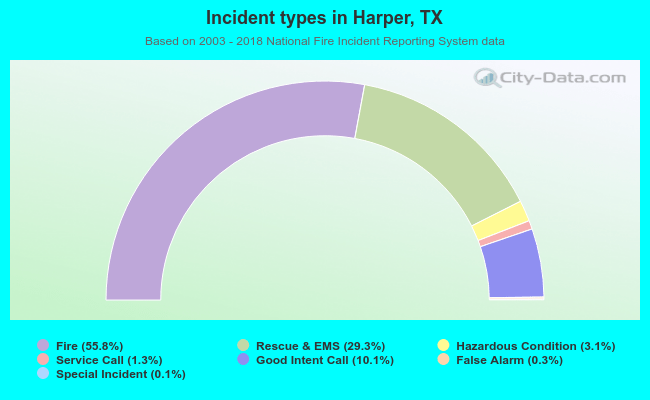 Out of all 713 cases reported during the years 2003 - 2018, the most belonged to the categories: Fire (55.8%), Overpressure Rupture (29.3%), and Service Call (10.1%).
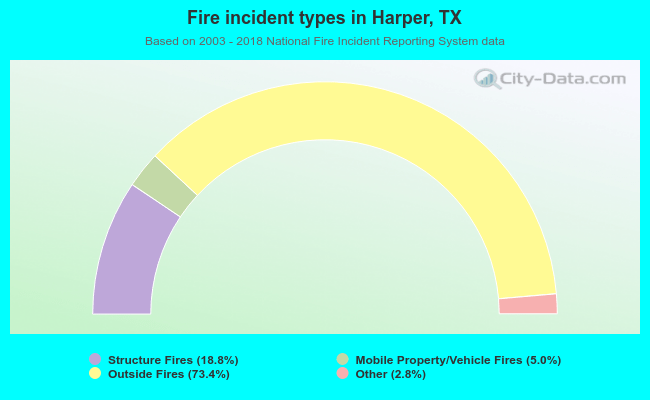 When looking into fire subcategories, the most reports belonged to: Outside Fires (73.4%), and Structure Fires (18.8%).