Harrisburg: Fire Incidents, Arkansas (AR)
Where are fire incidents reported in Harrisburg, AR
Something went wrong! Please refresh the page.
|
| |||||||||||||||||||||||||||||||||||||||||||||||||||||||||||||||||||||||||||||||||||||||||||||||||||||||||||||
| Other | 737 | |||||||||||||||||||||||||||||||||||||||||||||||||||||||||||||||||||||||||||||||||||||||||||||||||||||||||||||
2002 - 2018 National Fire Incident Reporting System (NFIRS) incidents
- Incident types reported to NFIRS in Harrisburg, AR
- 1,24964.0%Fire
- 64032.8%Rescue & EMS
- 211.1%Good Intent Call
- 180.9%Hazardous Condition
- 80.4%False Alarm
- 50.3%Service Call
- 50.3%Severe Weather
- 40.2%Overpressure Rupture
- 30.2%Special Incident
- Fire incident types reported to NFIRS in Harrisburg, AR
- 68354.7%Outside Fires
- 38530.8%Structure Fires
- 14711.8%Mobile Property/Vehicle Fires
- 342.7%Other
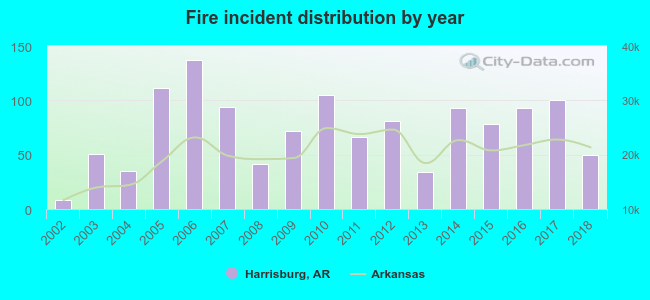 According to the data from the years 2002 - 2018 the average number of fires per year is 73. The highest number of fires - 137 took place in 2006, and the least - 8 in 2002. The data has an increasing trend.
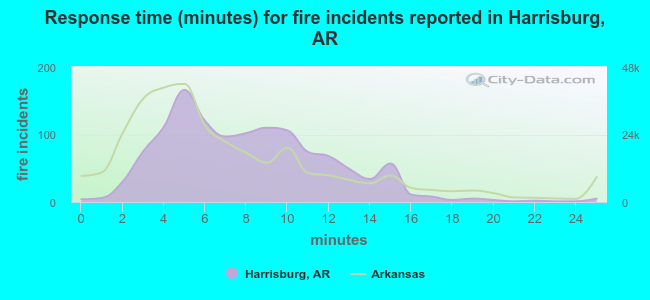 The median response time based on all reported fire incidents is 8 minutes. This is higher than the Arkansas median value.
The median response time in Harrisburg, AR compared to nearest cities:
(Note: Based on data for all years, including only cities with at least 500 fire incidents)
| Harrisburg: | 8 minutes |
| Trumann: | 3 minutes |
| Marked Tree: | 6 minutes |
| Jonesboro: | 5 minutes |
| Wynne: | 4 minutes |
| Bono: | 8 minutes |
| Earle: | 5 minutes |
| Newport: | 4 minutes |
| Paragould: | 4 minutes |
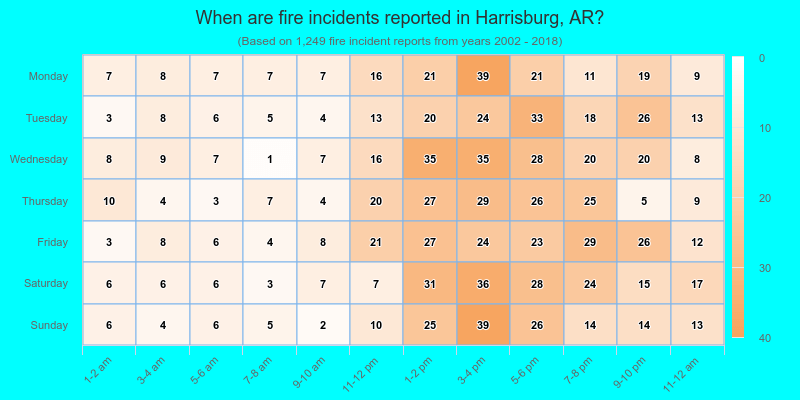
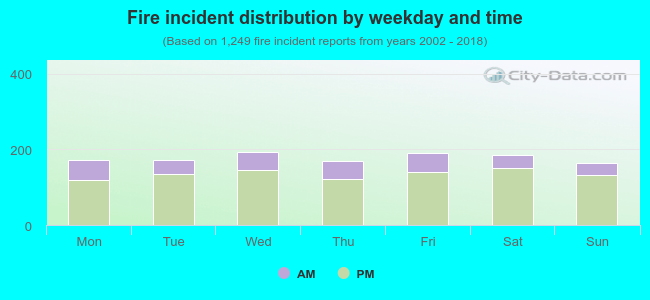 24.4% incidents where reported in the morning and 75.6% in the evening. The most fires (15.5%) took place on Wednesday, and the least (13.1%) on Sunday.
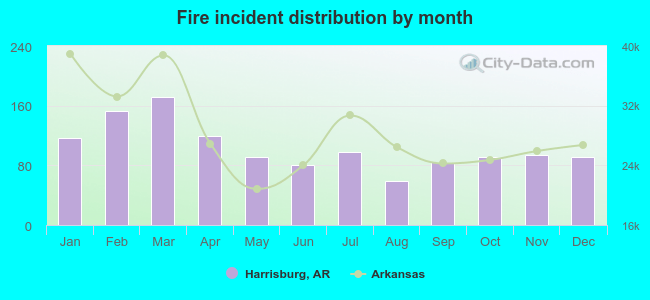 Based on the 1,249 reports from years 2002 - 2018 most fires (13.8%) took place during March, and the least (4.7%) in August.
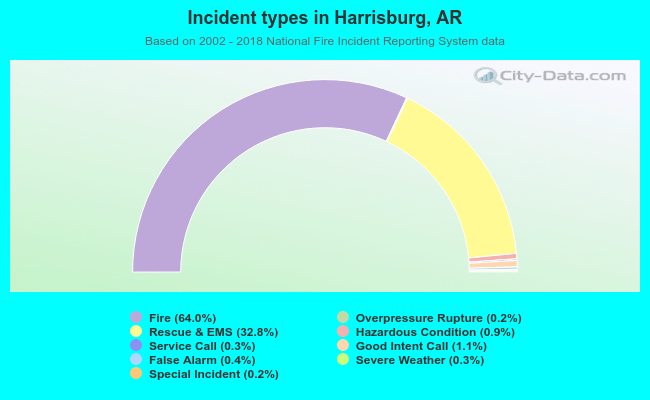 Out of all 1,953 cases reported during the years 2002 - 2018, the most belonged to the categories: Fire (64.0%), Rescue & EMS (32.8%), and Good Intent Call (1.1%).
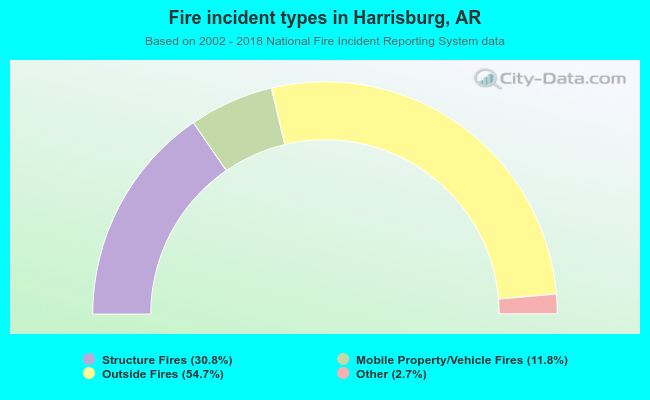 When looking into fire subcategories, the most incidents belonged to: Outside Fires (54.7%), and Structure Fires (30.8%).