Hart: Fire Incidents, Michigan (MI)
Where are fire incidents reported in Hart, MI
Something went wrong! Please refresh the page.
|
| |||||||||||||||||||||||||||||||||||||||||||||||||||||||||||||||||||||||||||||||||||||||||||||||||||||||||||||
2002 - 2018 National Fire Incident Reporting System (NFIRS) incidents
- Incident types reported to NFIRS in Hart, MI
- 38635.3%Fire
- 28726.3%Rescue & EMS
- 20418.7%Hazardous Condition
- 13011.9%Good Intent Call
- 433.9%Service Call
- 383.5%False Alarm
- 20.2%Overpressure Rupture
- 20.2%Severe Weather
- Fire incident types reported to NFIRS in Hart, MI
- 19450.3%Structure Fires
- 11028.5%Outside Fires
- 5714.8%Mobile Property/Vehicle Fires
- 256.5%Other
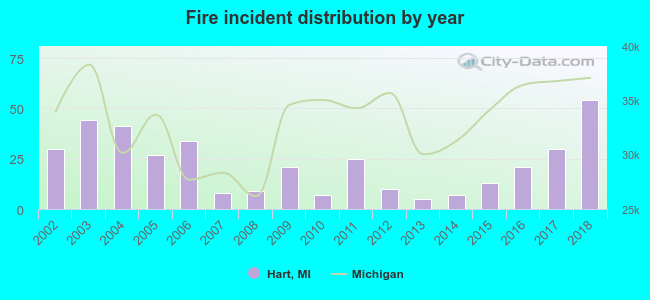 According to the data from the years 2002 - 2018 the average number of fires per year is 23. The highest number of reported fire incidents - 54 took place in 2018, and the least - 5 in 2013. The data has an increasing trend.
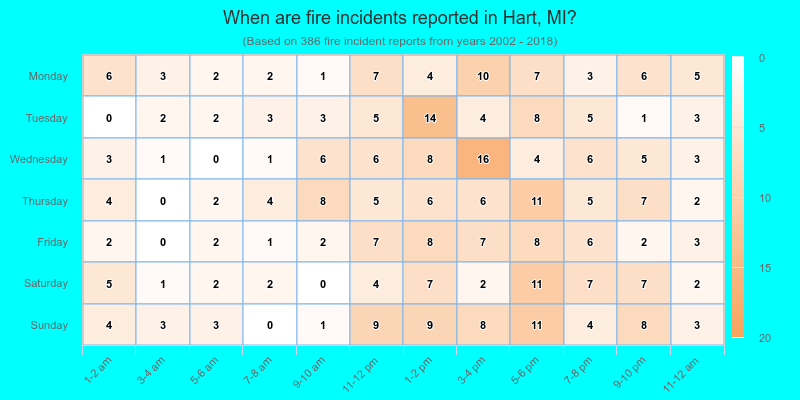
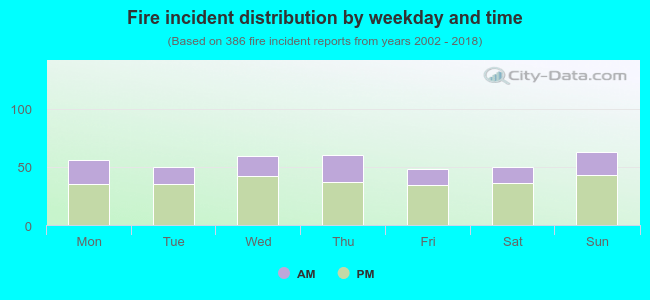 32.1% incidents where reported in the morning and 67.9% in the evening. The most fires (16.3%) took place on Sunday, and the least (12.4%) on Friday.
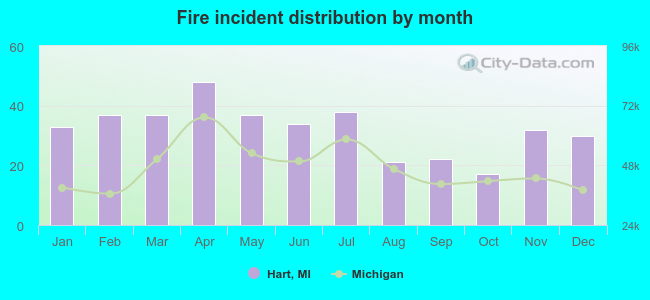 According to the 386 fires from years 2002 - 2018 most fires (12.4%) took place during April, and the least (4.4%) in October.
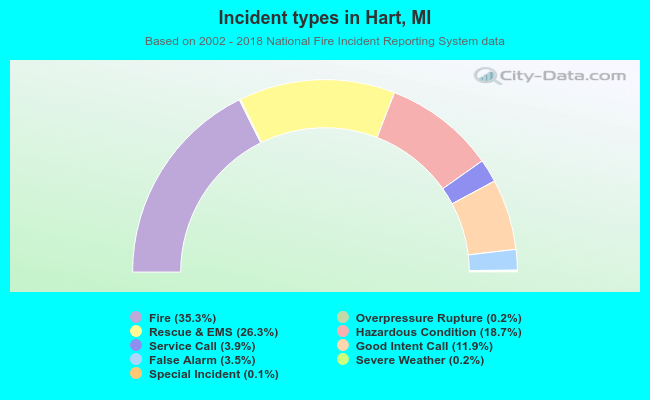 Out of all 1,093 cases reported during the years 2002 - 2018, the most belonged to the categories: Fire (35.3%), Rescue & EMS (26.3%), and Hazardous Condition (18.7%).
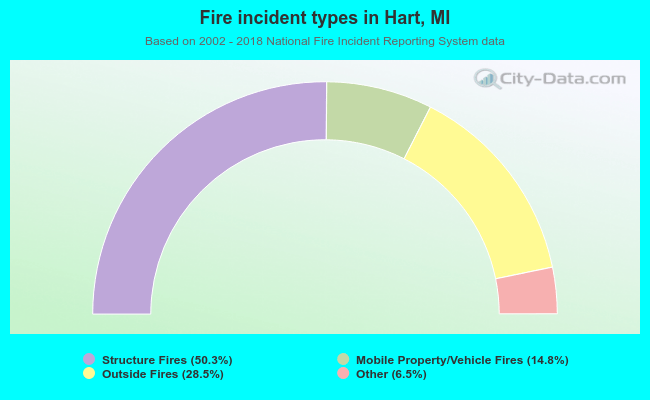 When looking into fire subcategories, the most incidents belonged to: Structure Fires (50.3%), and Outside Fires (28.5%).