Hartman: Fire Incidents, Arkansas (AR)
Where are fire incidents reported in Hartman, AR
Something went wrong! Please refresh the page.
|
| |||||||||||||||||||||||||||||||||||||||||||||||||||||||||||||||||||||||||||||||||||||||||||||||||||||||||||||
| Other | 120 | |||||||||||||||||||||||||||||||||||||||||||||||||||||||||||||||||||||||||||||||||||||||||||||||||||||||||||||
2002 - 2018 National Fire Incident Reporting System (NFIRS) incidents
- Incident types reported to NFIRS in Hartman, AR
- 34655.3%Fire
- 17828.4%Rescue & EMS
- 447.0%Good Intent Call
- 203.2%Hazardous Condition
- 162.6%Service Call
- 132.1%Severe Weather
- 81.3%False Alarm
- 10.2%Overpressure Rupture
- Fire incident types reported to NFIRS in Hartman, AR
- 21963.3%Outside Fires
- 7120.5%Structure Fires
- 329.2%Mobile Property/Vehicle Fires
- 246.9%Other
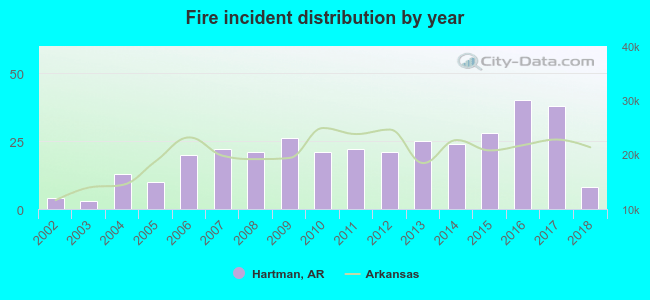 Based on the data from the years 2002 - 2018 the average number of fires per year is 20. The highest number of reported fires - 40 took place in 2016, and the least - 3 in 2003. The data has a rising trend.
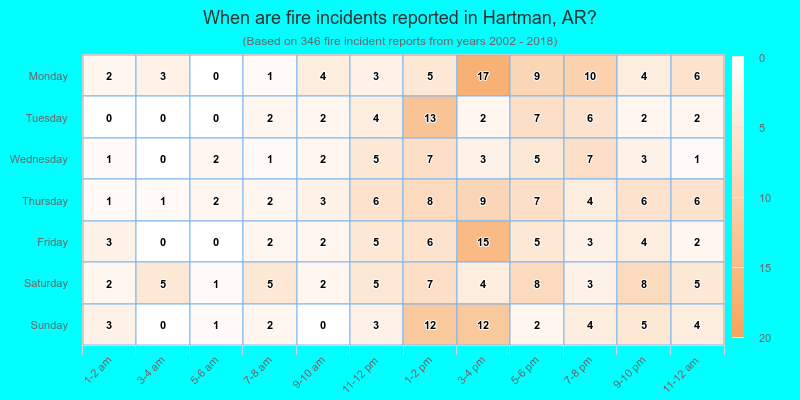
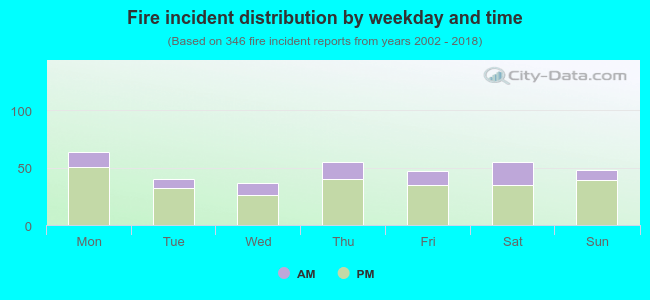 25.4% incidents where reported in the morning and 74.6% in the evening. The most fires (18.5%) took place on Monday, and the least (10.7%) on Wednesday.
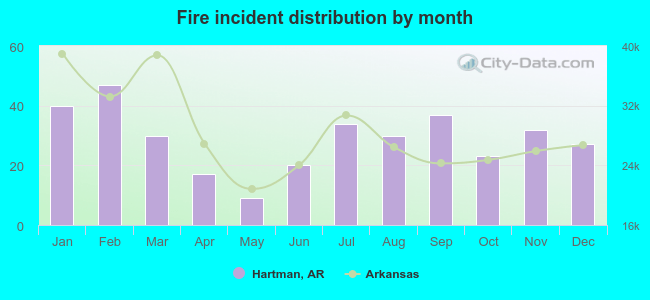 Based on the 346 fire incident reports from years 2002 - 2018 most fires (13.6%) took place during February, and the least (2.6%) in May.
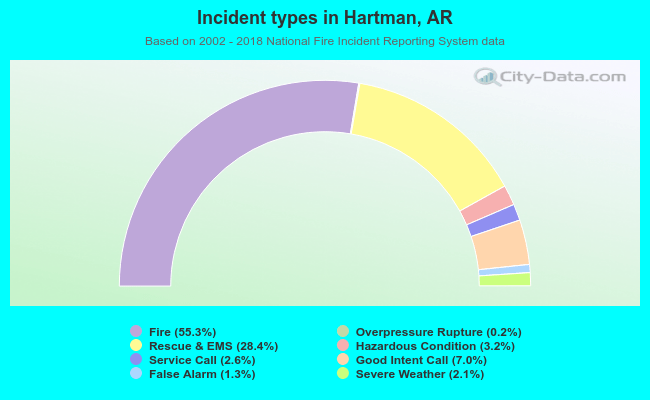 Out of all 626 cases reported during the years 2002 - 2018, the most belonged to the categories: Fire (55.3%), Rescue & EMS (28.4%), and Good Intent Call (7.0%).
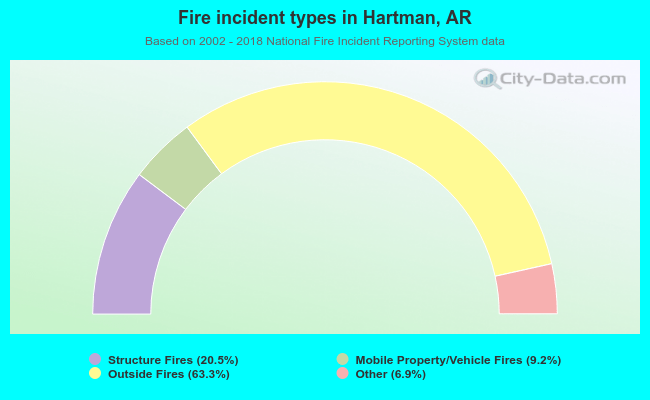 When looking into fire subcategories, the most reports belonged to: Outside Fires (63.3%), and Structure Fires (20.5%).