Hartsville: Fire Incidents, South Carolina (SC)
Where are fire incidents reported in Hartsville, SC
Something went wrong! Please refresh the page.
| Fire incidents reported | |
|---|---|
| Sreet name | Count |
| 5TH ST | 290 |
| OLD CAMDEN RD | 196 |
| CAROLINA AVE | 182 |
| HOME AVE | 130 |
| LAKEVIEW BLVD | 124 |
| BOBO NEWSOME HWY | 120 |
| 4TH ST | 112 |
| PATRICK HWY | 102 |
| SWIFT CREEK RD | 98 |
| MYRTLE ST | 82 |
| OUSLEYDALE RD | 80 |
| RUBY RD | 80 |
| BOBO NEWSOM HWY | 72 |
| 14TH ST | 64 |
| WASHINGTON ST | 62 |
| 6TH ST | 52 |
| FLINNS RD | 48 |
| 2ND ST | 46 |
| MARQUIS HWY | 46 |
| CENTER RD | 42 |
| HARTLAND DR | 42 |
| SOCIETY AVE | 38 |
| CLYDE RD | 36 |
| RAILROAD AVE | 36 |
| 8TH ST | 34 |
| BAY RD | 34 |
| LYDIA HWY | 34 |
| NEW MARKET RD | 34 |
| BILLY FARROW HWY | 32 |
| STONEWALL ST | 32 |
| Other | 645 |
2002 - 2018 National Fire Incident Reporting System (NFIRS) incidents
- Incident types reported to NFIRS in Hartsville, SC
- 3,02525.7%Fire
- 2,97125.3%Hazardous Condition
- 2,72723.2%Rescue & EMS
- 1,26410.7%Good Intent Call
- 1,18210.0%False Alarm
- 4724.0%Service Call
- 660.6%Severe Weather
- 390.3%Special Incident
- 160.1%Overpressure Rupture
- Fire incident types reported to NFIRS in Hartsville, SC
- 1,48249.0%Outside Fires
- 95331.5%Structure Fires
- 48115.9%Mobile Property/Vehicle Fires
- 1093.6%Other
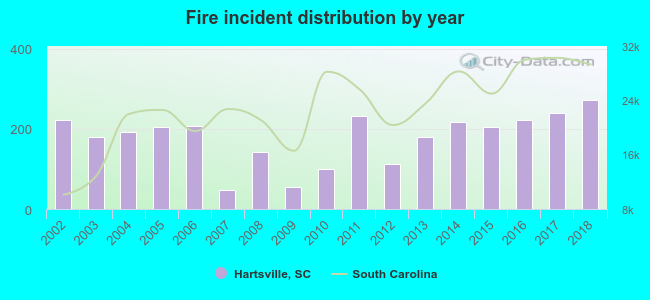 According to the data from the years 2002 - 2018 the average number of fire incidents per year is 178. The highest number of reported fire incidents - 271 took place in 2018, and the least - 48 in 2007. The data has a growing trend.
The average number of yearly fire incidents per 10k residents in Hartsville, SC compared to nearest cities:
(Note: Based on data for the last 3 years, including only cities with population 5,000 and above)
| Hartsville: | 310.7 |
| Darlington: | 247.1 |
| Florence: | 126.4 |
| Cheraw: | 162.3 |
| Bennettsville: | 181.1 |
| Camden: | 142.2 |
| Sumter: | 169.2 |
| Lugoff: | 130.0 |
| Lake City: | 190.6 |
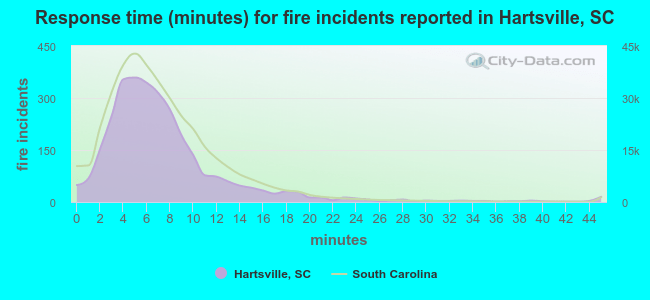 The median response time based on all reported fire incidents is 6 minutes. This is about the same as the state median value.
The median response time in Hartsville, SC compared to nearest cities:
(Note: Based on data for all years, including only cities with at least 500 fire incidents)
| Hartsville: | 6 minutes |
| Darlington: | 6 minutes |
| Bishopville: | 10 minutes |
| Lynchburg: | 11 minutes |
| Florence: | 6 minutes |
| Cheraw: | 6 minutes |
| Bennettsville: | 5 minutes |
| Camden: | 4 minutes |
| Kershaw: | 12 minutes |
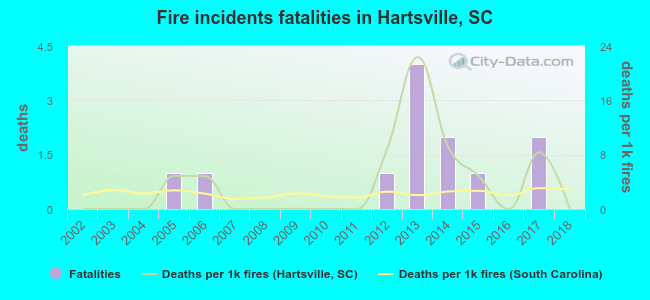 Based on the reports from the years 2002 - 2018 the average number of fire-related fatalities per year is 1. The highest number of deaths - 4 took place in 2013, and the lowest - 0 in 2002. The data has a constant trend.
The average number of fatalities per 1,000 fire incidents is 4. This indicator was the highest - 22 in 2013, and the lowest 0 in 2002. The trend for deaths per 1,000 fire incidents is constant. Compared to the South Carolina value the number of fatalities per 1,000 fires is higher.
Based on the reports from the years 2002 - 2018 the average number of fire-related fatalities per year is 1. The highest number of deaths - 4 took place in 2013, and the lowest - 0 in 2002. The data has a constant trend.
The average number of fatalities per 1,000 fire incidents is 4. This indicator was the highest - 22 in 2013, and the lowest 0 in 2002. The trend for deaths per 1,000 fire incidents is constant. Compared to the South Carolina value the number of fatalities per 1,000 fires is higher.
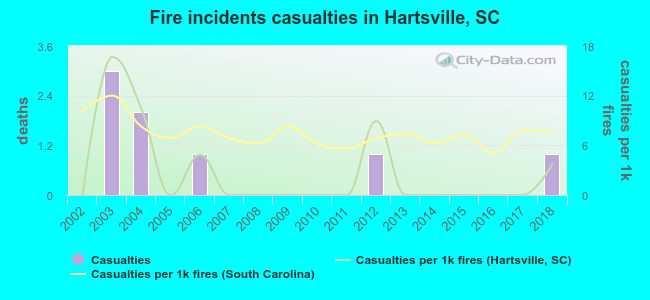 Based on the data from the years 2002 - 2018 the average number of fire-related casualties per year is 0. The highest number of injuries - 3 took place in 2003, and the lowest - 0 in 2002. The data has an increasing trend.
The average number of injuries per 1,000 fire incidents is 3. This indicator was the highest - 17 in 2003, and the lowest 0 in 2002. The trend for injuries per 1,000 incidents is increasing. Compared to the South Carolina value the number of injuries per 1,000 fire incidents is much lower.
Based on the data from the years 2002 - 2018 the average number of fire-related casualties per year is 0. The highest number of injuries - 3 took place in 2003, and the lowest - 0 in 2002. The data has an increasing trend.
The average number of injuries per 1,000 fire incidents is 3. This indicator was the highest - 17 in 2003, and the lowest 0 in 2002. The trend for injuries per 1,000 incidents is increasing. Compared to the South Carolina value the number of injuries per 1,000 fire incidents is much lower.Casualties per 1,000 incidents in Hartsville, SC compared to nearest cities:
(Note: Based on data for all years, including only cities with at least 500 fire incidents)
| Hartsville: | 2.6 |
| Darlington: | 1.6 |
| Bishopville: | 0.0 |
| Lynchburg: | 4.4 |
| Florence: | 8.5 |
| Cheraw: | 6.6 |
| Bennettsville: | 0.4 |
| Camden: | 10.0 |
| Kershaw: | 0.6 |
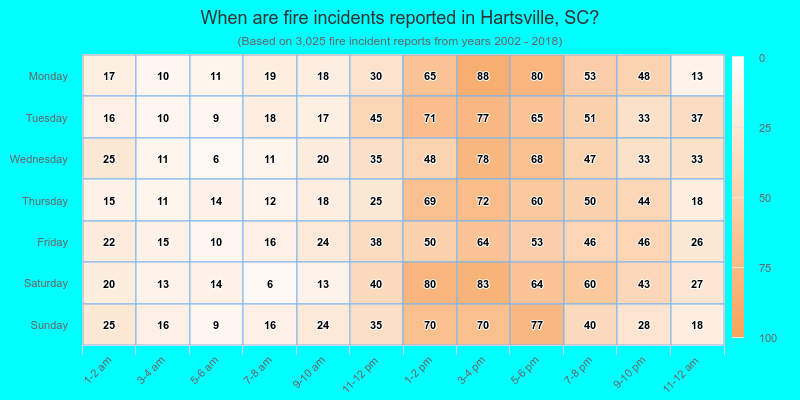
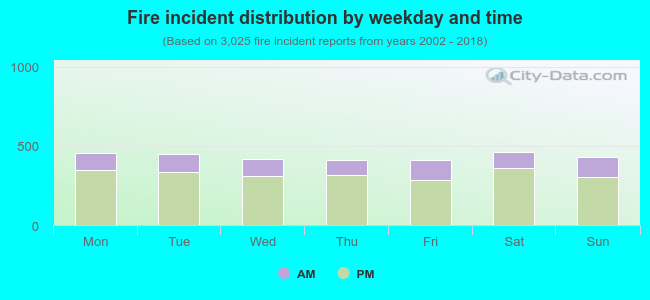 25.8% incidents where reported in the morning and 74.2% in the evening. The most fires (15.3%) took place on Saturday, and the least (13.5%) on Thursday.
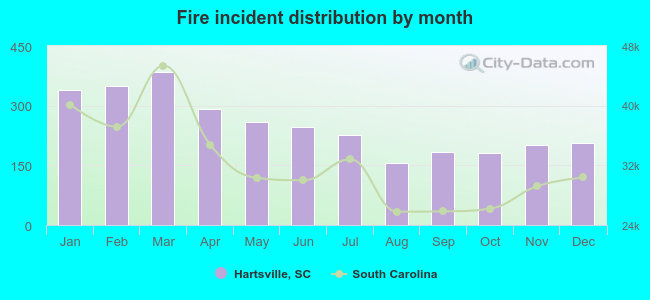 Based on the 3,025 reports from years 2002 - 2018 most fires (12.7%) took place during March, and the least (5.1%) in August.
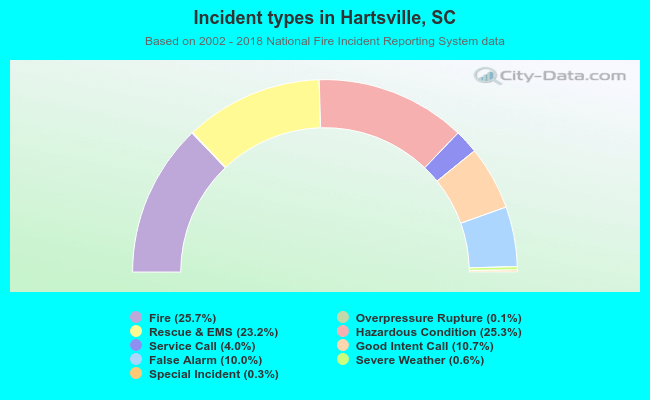 Out of all 11,762 cases reported during the years 2002 - 2018, the most belonged to the categories: Fire (25.7%), Hazardous Condition (25.3%), and Rescue & EMS (23.2%).
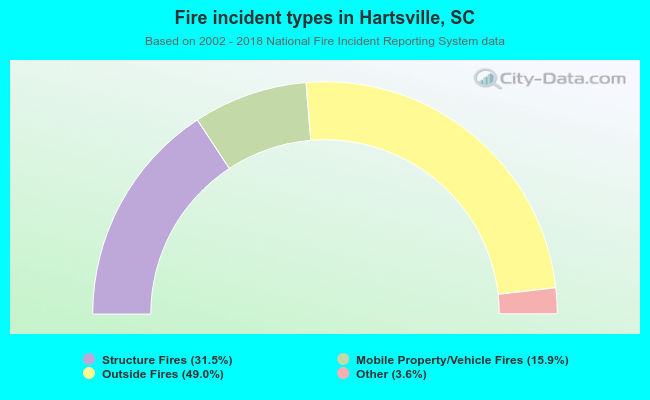 When looking into fire subcategories, the most reports belonged to: Outside Fires (49.0%), and Structure Fires (31.5%).