| Fire incidents reported |
|---|
| Sreet name | Count |
|---|
| HARMON RD | 30 | | WESTPORT PKWY | 26 | | AVONDALE HASLET RD | 20 | | WESTPORT PKY | 20 | | BLUE MOUND RD | 16 | | 156 HWY | 14 | | HARMON RD | 14 | | HWY 156 S | 14 | | BONDS RANCH RD | 12 | | HWY 287 | 10 | | INTERMODAL PKWY N | 10 | | ODESSA DR | 10 | | SCHOOLHOUSE RD | 10 | | BAYNE RD | 8 | | KELLER HASLET RD | 8 | | SCHREIBER DR | 8 | | WHITE LN | 8 | | WHITE LN | 8 | | 28781 HWY | 6 | | BERRY DR | 6 | | BLUE MOUND RD | 6 | | BRENTWOOD LN | 6 | | CEDAR LN | 6 | | GAMMILL ST | 6 | | KELLER HICKS RD | 6 |
| | | Fire incidents reported |
|---|
| Sreet name | Count |
|---|
| LEWIS LN | 6 | | LEWIS LN | 6 | | ODESSA | 6 | | RIDGE COUNTRY RD | 6 | | SCHOOL HOUSE RD | 6 | | SPRINGWAY DR | 6 | | VIRGINIA LN | 6 | | WHITE | 6 | | 287 & 81 HWY | 4 | | 287 HWY | 4 | | ASTON FALLS DR | 4 | | AVONDALE HASLET | 4 | | AVONDALE HASLET RD | 4 | | BERRY | 4 | | BRENTWOOD | 4 | | COUNTRY LA | 4 | | HWY 156 N | 4 | | JOHN DAY RD | 4 | | KELLER HASLET RD N | 4 | | SCHOOLHOUSE RD | 4 | | SONGBIRD LN | 4 | | VIRGINIA LN. | 4 | | VISTA RANCH WAY | 4 | | 107 BRENTWOOD | 2 | | |
|
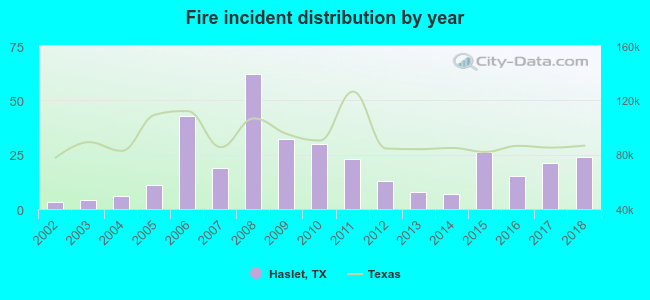 According to the data from the years 2002 - 2018 the average number of fires per year is 20. The highest number of fire incidents - 62 took place in 2008, and the least - 3 in 2002. The data has an increasing trend.
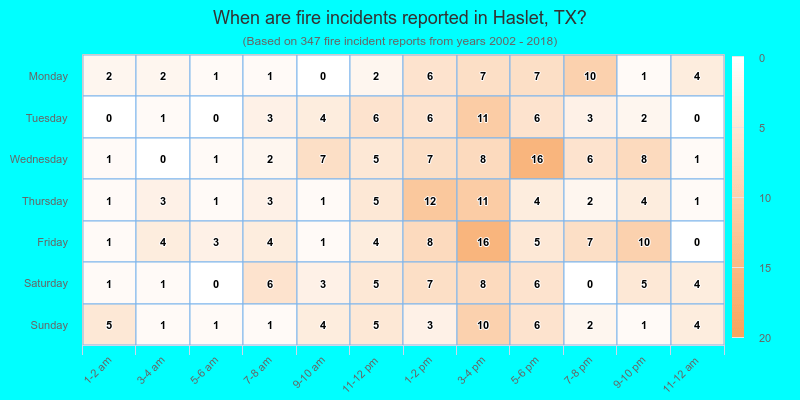
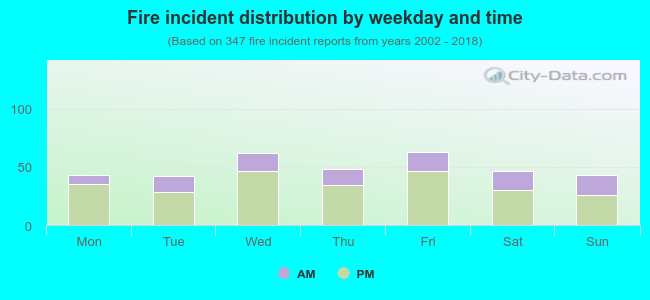 29.4% incidents where reported in the morning and 70.6% in the evening. The most fires (18.2%) took place on Friday, and the least (12.1%) on Tuesday.
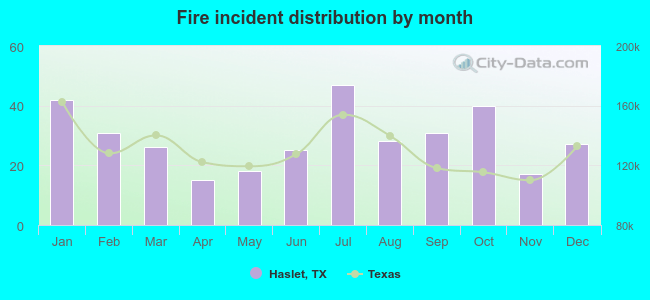 Based on the 347 incident reports from years 2002 - 2018 most fires (13.5%) took place during July, and the least (4.3%) in April.
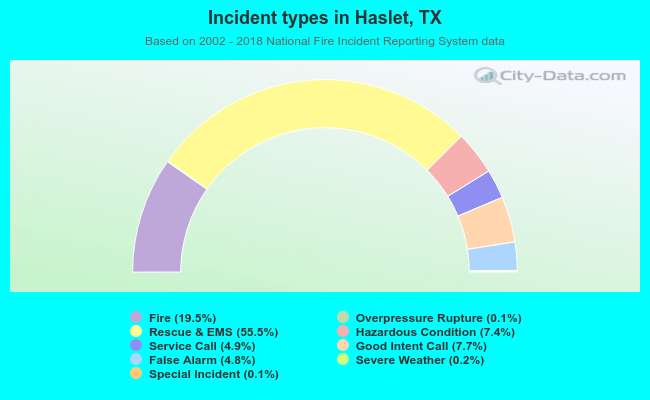 Out of all 1,782 cases reported during the years 2002 - 2018, the most belonged to the categories: Rescue & EMS (55.5%), Fire (19.5%), and Good Intent Call (7.7%).
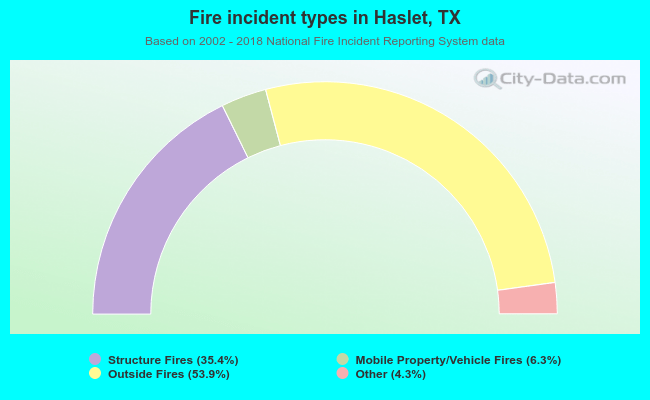 When looking into fire subcategories, the most reports belonged to: Outside Fires (53.9%), and Structure Fires (35.4%).