Hatfield: Fire Incidents, Pennsylvania (PA)
Where are fire incidents reported in Hatfield, PA
Something went wrong! Please refresh the page.
|
| |||||||||||||||||||||||||||||||||||||||||||||||||||||||||||||||||||||||||||||||||||||||||||||||||||||||||||||
2004 - 2018 National Fire Incident Reporting System (NFIRS) incidents
- Incident types reported to NFIRS in Hatfield, PA
- 30040.1%Fire
- 16421.9%Hazardous Condition
- 13718.3%False Alarm
- 506.7%Service Call
- 476.3%Rescue & EMS
- 405.3%Good Intent Call
- 111.5%Special Incident
- Fire incident types reported to NFIRS in Hatfield, PA
- 17257.3%Structure Fires
- 8327.7%Outside Fires
- 237.7%Other
- 227.3%Mobile Property/Vehicle Fires
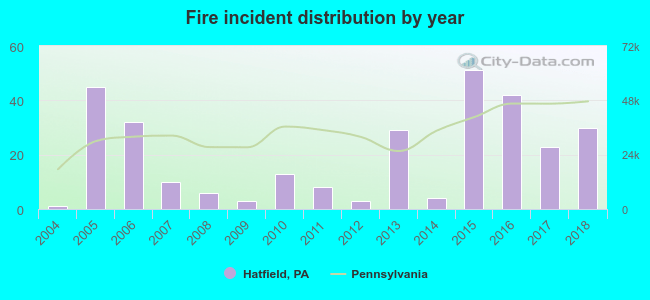 Based on the data from the years 2004 - 2018 the average number of fires per year is 20. The highest number of fire incidents - 51 took place in 2015, and the least - 1 in 2004. The data has a growing trend.
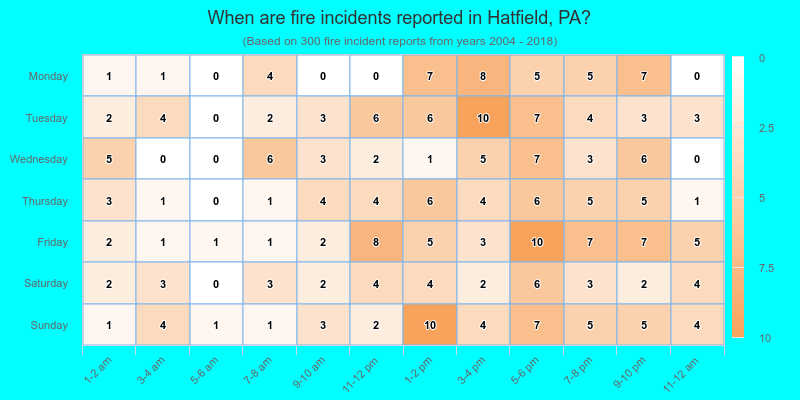
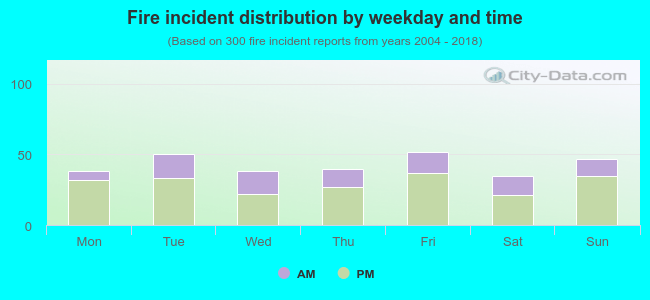 31.0% incidents where reported in the morning and 69.0% in the evening. The most fires (17.3%) took place on Friday, and the least (11.7%) on Saturday.
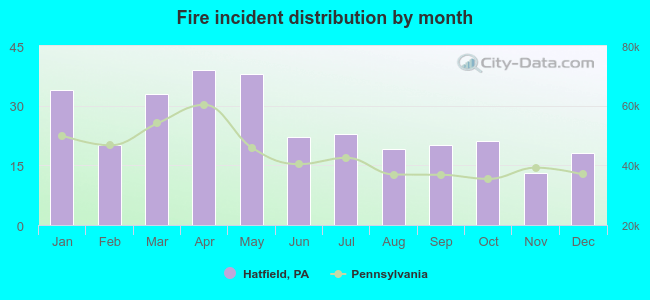 According to the 300 fire incidents from years 2004 - 2018 most fires (13.0%) took place during April, and the least (4.3%) in November.
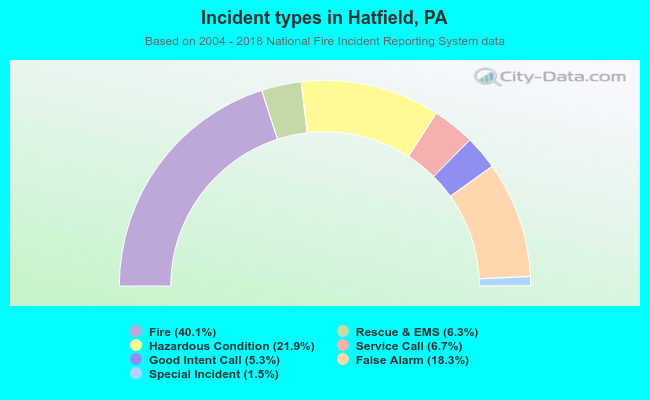 Out of all 749 cases reported during the years 2004 - 2018, the most belonged to the categories: Fire (40.1%), Rescue & EMS (21.9%), and Good Intent Call (18.3%).
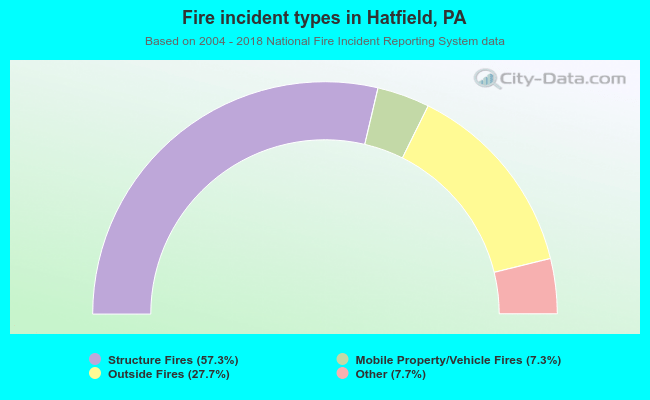 When looking into fire subcategories, the most incidents belonged to: Structure Fires (57.3%), and Outside Fires (27.7%).