Hershey: Fire Incidents, Nebraska (NE)
Where are fire incidents reported in Hershey, NE
Something went wrong! Please refresh the page.
|
| |||||||||||||||||||||||||||||||||||||||||||||||||||||||||||||||||||||||||||||||||||||||||||||||||||||||||||||
| Other | 10 | |||||||||||||||||||||||||||||||||||||||||||||||||||||||||||||||||||||||||||||||||||||||||||||||||||||||||||||
2002 - 2018 National Fire Incident Reporting System (NFIRS) incidents
- Incident types reported to NFIRS in Hershey, NE
- 36148.4%Rescue & EMS
- 29839.9%Fire
- 354.7%Good Intent Call
- 233.1%Hazardous Condition
- 111.5%False Alarm
- 101.3%Service Call
- 40.5%Severe Weather
- 40.5%Special Incident
- Fire incident types reported to NFIRS in Hershey, NE
- 17659.1%Outside Fires
- 7424.8%Mobile Property/Vehicle Fires
- 3913.1%Structure Fires
- 93.0%Other
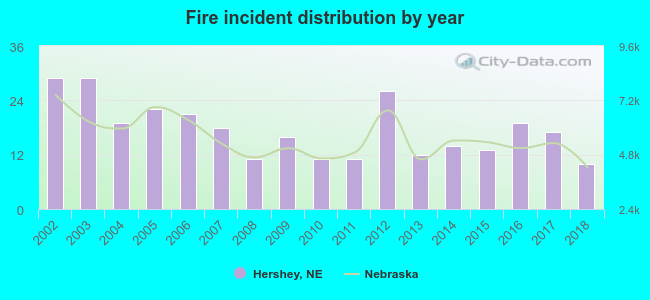 Based on the data from the years 2002 - 2018 the average number of fires per year is 18. The highest number of fire incidents - 29 took place in 2002, and the least - 10 in 2018. The data has a dropping trend.
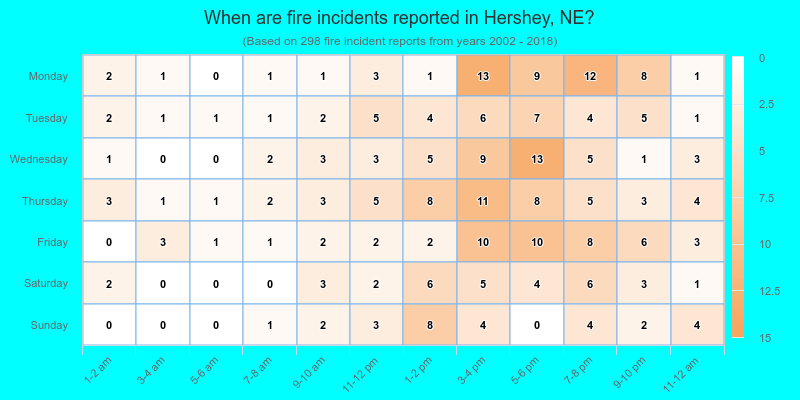
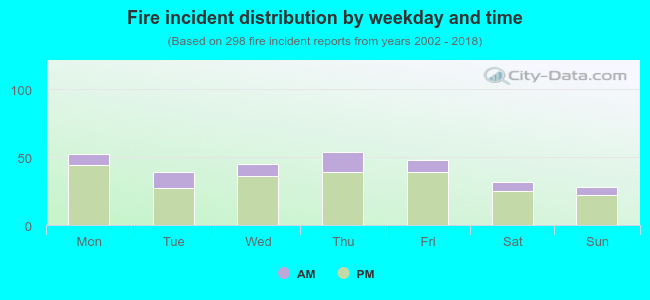 22.1% incidents where reported in the morning and 77.9% in the evening. The most fires (18.1%) took place on Thursday, and the least (9.4%) on Sunday.
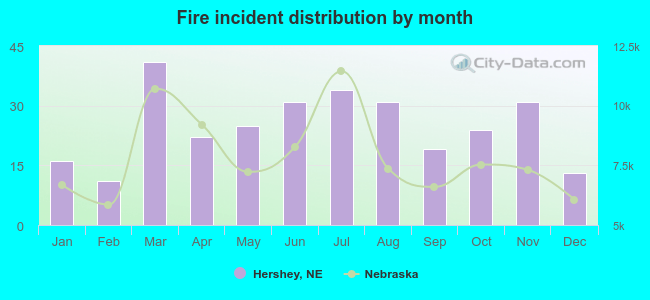 Based on the 298 reports from years 2002 - 2018 most fires (13.8%) took place during March, and the least (3.7%) in February.
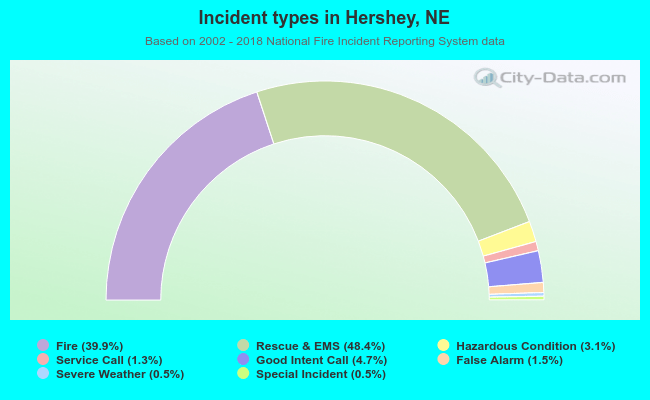 Out of all 746 cases reported during the years 2002 - 2018, the most belonged to the categories: Overpressure Rupture (48.4%), Fire (39.9%), and Service Call (4.7%).
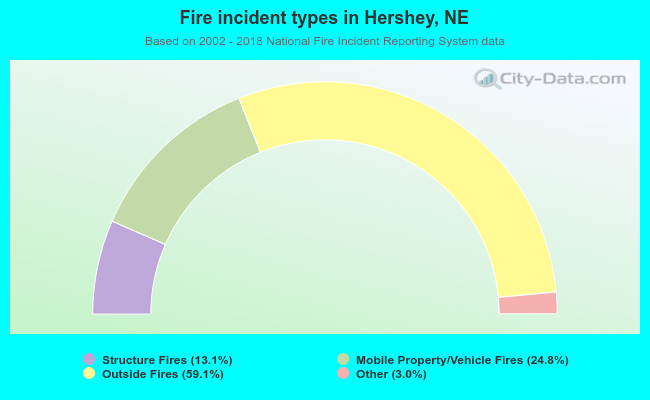 When looking into fire subcategories, the most reports belonged to: Outside Fires (59.1%), and Mobile Property/Vehicle Fires (24.8%).