High Ridge: Fire Incidents, Missouri (MO)
Where are fire incidents reported in High Ridge, MO
Something went wrong! Please refresh the page.
| Fire incidents reported | |
|---|---|
| Sreet name | Count |
| GRAVOIS RD | 62 |
| HIGH RIDGE BLVD | 46 |
| HILLSBORO VALLEY PARK RD | 36 |
| STATE RT 30 | 32 |
| WILLIAMS CREEK RD | 32 |
| ROCK CREEK RD | 30 |
| ANTIRE RD | 26 |
| HUNNING RD | 26 |
| RIDGE POINT DR | 22 |
| LITTLE ANTIRE RD | 20 |
| BRENNAN RD | 18 |
| FRANKS RD | 18 |
| MEADOW DR | 18 |
| STIEREN DR | 18 |
| SCHUMACHER RD | 16 |
| FOUR RIDGE RD | 14 |
| LAUREL DR | 14 |
| STATE RD PP | 14 |
| CAROL PARK RD | 12 |
| COUNTRY CLUB DR | 12 |
| CROSSROADS PL | 12 |
| DEL RIO DR | 12 |
| PEMBROKE LN | 12 |
| THOREAU TRL | 12 |
| BRIARWOOD DR | 10 |
| DILLON PLAZA DR | 10 |
| GOLDEN CIR | 10 |
| GREEN VALLEY DR | 10 |
| HILGERT DR | 10 |
| HWY 30 | 10 |
| Other | 522 |
2002 - 2018 National Fire Incident Reporting System (NFIRS) incidents
- Incident types reported to NFIRS in High Ridge, MO
- 3,05748.0%Rescue & EMS
- 1,11617.5%Fire
- 74811.8%Good Intent Call
- 64910.2%Hazardous Condition
- 5108.0%Service Call
- 2634.1%False Alarm
- 100.2%Special Incident
- Fire incident types reported to NFIRS in High Ridge, MO
- 52847.3%Outside Fires
- 41937.5%Structure Fires
- 13111.7%Mobile Property/Vehicle Fires
- 383.4%Other
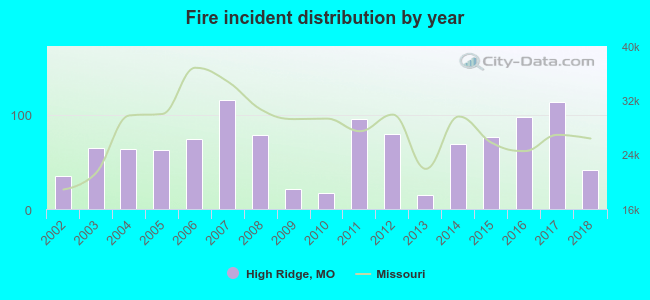 Based on the data from the years 2002 - 2018 the average number of fires per year is 66. The highest number of fires - 115 took place in 2007, and the least - 15 in 2013. The data has an increasing trend.
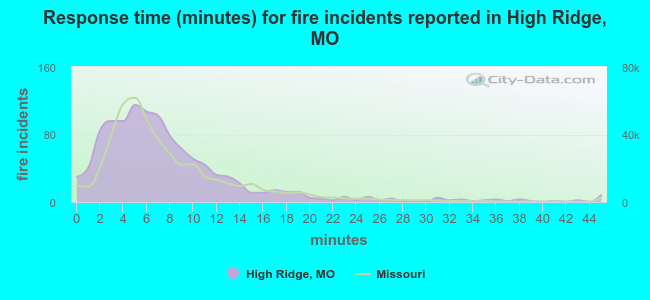 The median response time based on all reported fire incidents is 6 minutes. This is comparable to the state median value.
The median response time in High Ridge, MO compared to nearest cities:
(Note: Based on data for all years, including only cities with at least 500 fire incidents)
| High Ridge: | 6 minutes |
| Fenton: | 6 minutes |
| Valley Park: | 6 minutes |
| Eureka: | 8 minutes |
| Sunset Hills: | 5 minutes |
| Manchester: | 5 minutes |
| Arnold: | 6 minutes |
| Ballwin: | 5 minutes |
| Ellisville: | 4 minutes |
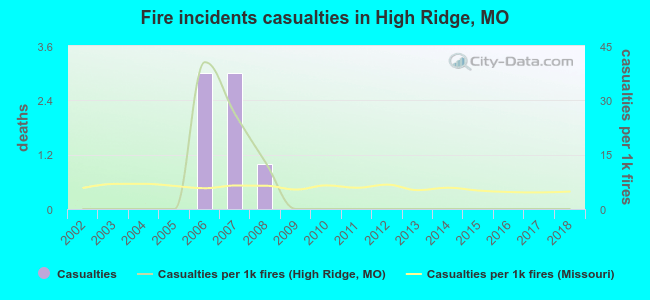 Based on the data from the years 2002 - 2018 the average number of fire-related yearly casualties is 0. The highest number of reported injuries - 3 took place in 2006, and the lowest - 0 in 2002. The data has a constant trend.
The average number of injuries per 1,000 fire incidents is 5. This indicator was the highest - 41 in 2006, and the lowest 0 in 2002. The trend for casualties per 1,000 fires is constant. Compared to the state value the number of casualties per 1,000 incidents is similar.
Based on the data from the years 2002 - 2018 the average number of fire-related yearly casualties is 0. The highest number of reported injuries - 3 took place in 2006, and the lowest - 0 in 2002. The data has a constant trend.
The average number of injuries per 1,000 fire incidents is 5. This indicator was the highest - 41 in 2006, and the lowest 0 in 2002. The trend for casualties per 1,000 fires is constant. Compared to the state value the number of casualties per 1,000 incidents is similar.Casualties per 1,000 incidents in High Ridge, MO compared to nearest cities:
(Note: Based on data for all years, including only cities with at least 500 fire incidents)
| High Ridge: | 6.3 |
| Fenton: | 2.4 |
| Valley Park: | 4.4 |
| Eureka: | 15.1 |
| Sunset Hills: | 3.4 |
| Manchester: | 10.1 |
| Arnold: | 4.5 |
| Ballwin: | 9.9 |
| Ellisville: | 12.1 |
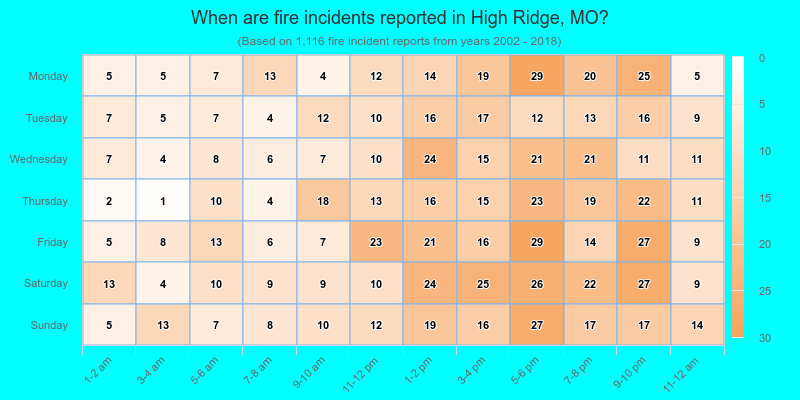
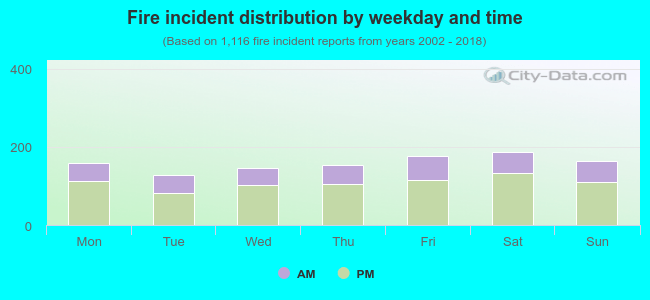 31.6% incidents where reported in the morning and 68.4% in the evening. The most fires (16.8%) took place on Saturday, and the least (11.5%) on Tuesday.
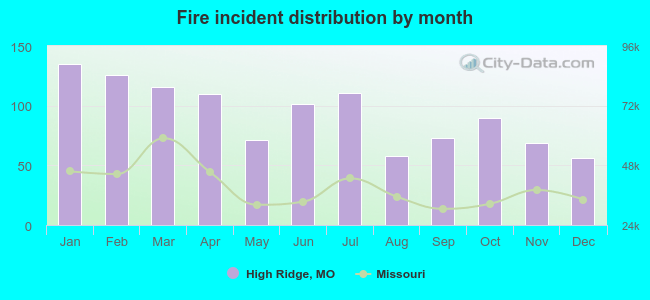 According to the 1,116 reports from years 2002 - 2018 most fires (12.1%) took place during January, and the least (5.0%) in December.
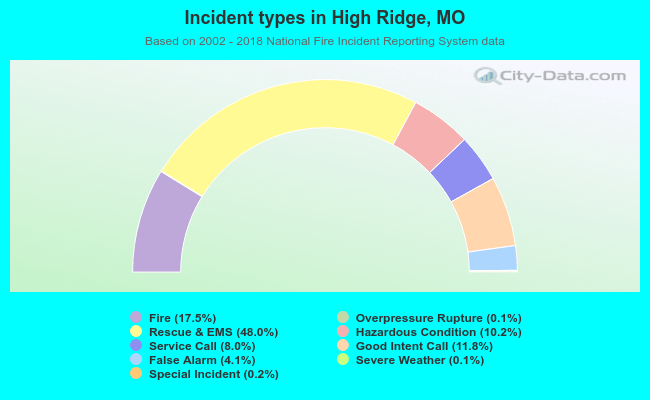 Out of all 6,365 cases reported during the years 2002 - 2018, the most belonged to the categories: Rescue & EMS (48.0%), Fire (17.5%), and Good Intent Call (11.8%).
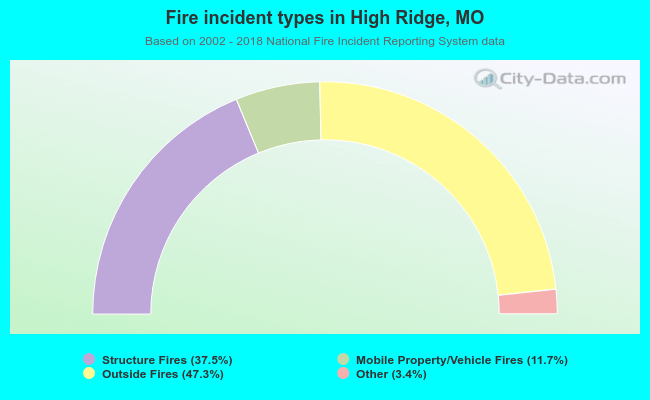 When looking into fire subcategories, the most reports belonged to: Outside Fires (47.3%), and Structure Fires (37.5%).