Hinsdale: Fire Incidents, New York (NY)
Where are fire incidents reported in Hinsdale, NY
Something went wrong! Please refresh the page.
|
| |||||||||||||||||||||||||||||||||||||||||||||||||||||||||||||||||||||||||||||||||||||||||||||||||||||||||||||
2003 - 2018 National Fire Incident Reporting System (NFIRS) incidents
- Incident types reported to NFIRS in Hinsdale, NY
- 95961.6%Rescue & EMS
- 20112.9%Fire
- 1469.4%Hazardous Condition
- 1076.9%Service Call
- 664.2%Good Intent Call
- 463.0%False Alarm
- 281.8%Severe Weather
- 30.2%Overpressure Rupture
- Fire incident types reported to NFIRS in Hinsdale, NY
- 9446.8%Structure Fires
- 5728.4%Outside Fires
- 4522.4%Mobile Property/Vehicle Fires
- 52.5%Other
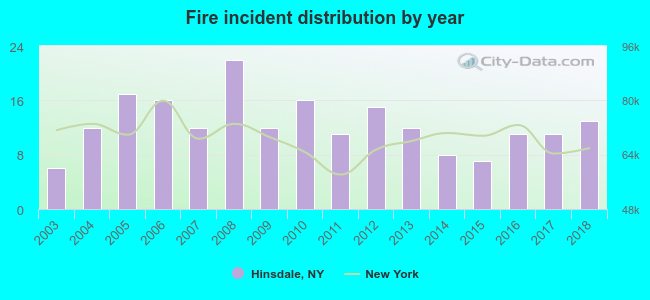 According to the data from the years 2003 - 2018 the average number of fires per year is 13. The highest number of reported fires - 22 took place in 2008, and the least - 6 in 2003. The data has an increasing trend.
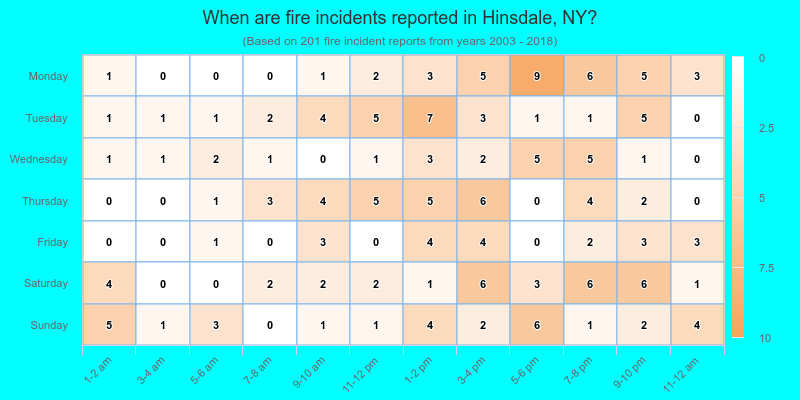
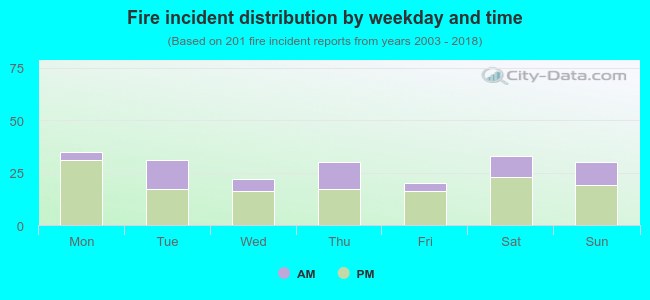 30.8% incidents where reported in the morning and 69.2% in the evening. The most fires (17.4%) took place on Monday, and the least (10.0%) on Friday.
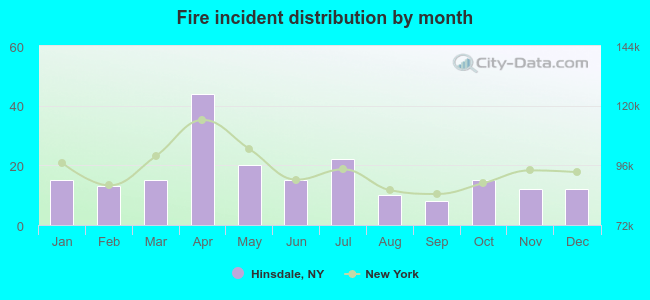 According to the 201 fire incidents from years 2003 - 2018 most fires (21.9%) took place during April, and the least (4.0%) in September.
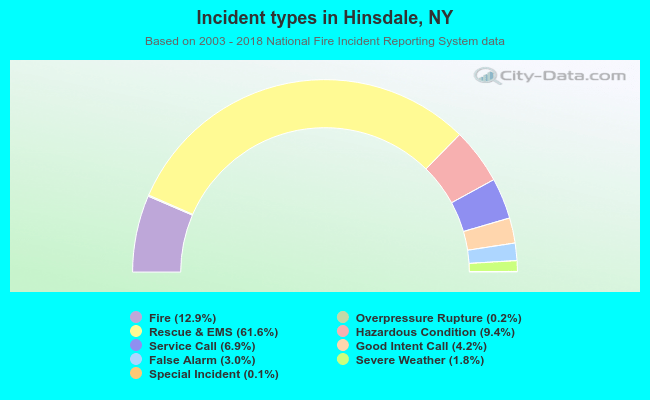 Out of all 1,557 cases reported during the years 2003 - 2018, the most belonged to the categories: Rescue & EMS (61.6%), Fire (12.9%), and Hazardous Condition (9.4%).
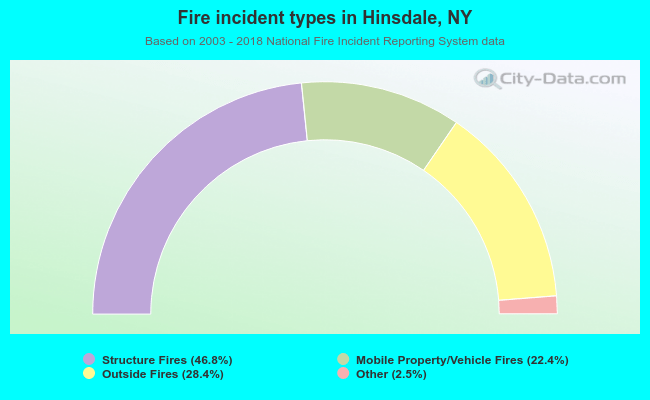 When looking into fire subcategories, the most reports belonged to: Structure Fires (46.8%), and Outside Fires (28.4%).