| Fire incidents reported |
|---|
| Sreet name | Count |
|---|
| INTERSTATE 40 | 72 | | US 641 | 20 | | BIRDSONG RD | 18 | | 192 HWY | 12 | | DOUGLAS DR | 10 | | LIBERTY CHURCH RD | 10 | | MCILLWAIN RD | 10 | | 641 HWY | 8 | | I40 | 8 | | KIRK TRL | 8 | | OLD UNION CHURCH | 8 | | OLD UNION CHURCH RD | 8 | | BIRDSONG ROAD | 6 | | COXBURG RD | 6 | | GOBBLER DR | 6 | | HIGHWAY 192 | 6 | | KELLY RD | 6 | | KING RD | 6 | | MORRIS RD | 6 | | STOKES RD | 6 | | WHITE BRANCH RD | 6 | | 12280 BIRDSONG ROAD | 4 | | 1465 MARINA RIDGE RD | 4 | | 300 BEECH ACRES | 4 | | 461 GOSSETT RD. | 4 |
| | | Fire incidents reported |
|---|
| Sreet name | Count |
|---|
| 641 | 4 | | 75 MAGNOLIA LN | 4 | | 9840 HWY 641 S | 4 | | ALLEN MILL BRIDGE RD | 4 | | BALD KNOB RD | 4 | | BEECH ACRES DR | 4 | | BIBLE HILL RD | 4 | | BIRDSONG RD | 4 | | CONLEY BRANCH RD | 4 | | GOSSET RD | 4 | | HATLEY RD | 4 | | HWY 641 | 4 | | I40 WESTBOUND | 4 | | LAKEVIEW TRL | 4 | | LISA LANE | 4 | | MARY AVE | 4 | | OLD HWY 69 | 4 | | OLD US 69 | 4 | | PAULINE RD | 4 | | PROSPECT RD | 4 | | ROCKPORT/MCILLWAIN & S COXBURG | 4 | | SUNSET DR | 4 | | SUNSET RD | 4 | | TN 69 | 4 | | |
|
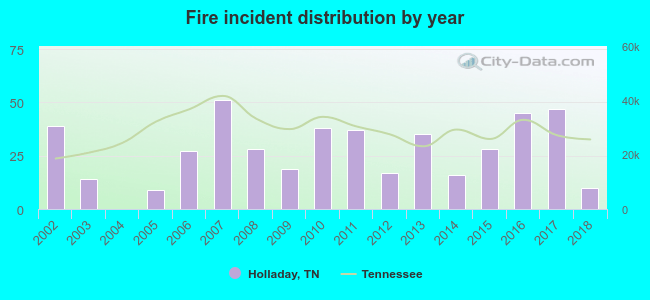 Based on the data from the years 2002 - 2018 the average number of fires per year is 27. The highest number of reported fires - 51 took place in 2007, and the least - 0 in 2004. The data has a declining trend.
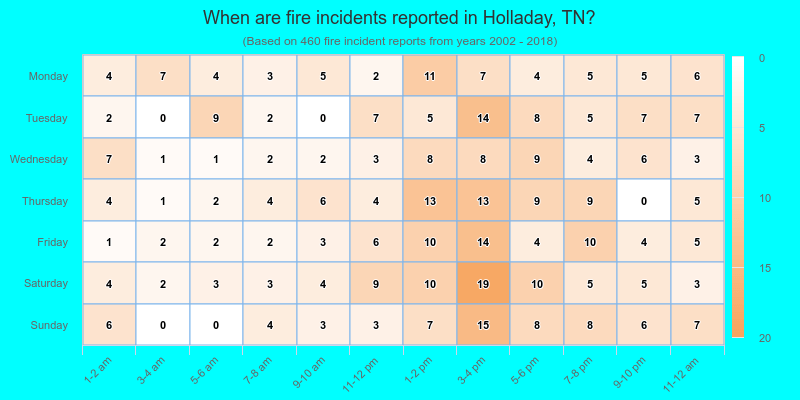
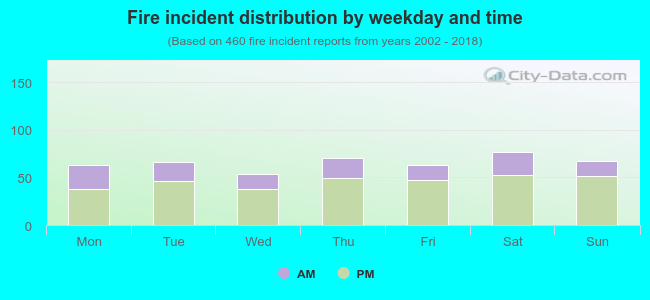 30.2% incidents where reported in the morning and 69.8% in the evening. The most fires (16.7%) took place on Saturday, and the least (11.7%) on Wednesday.
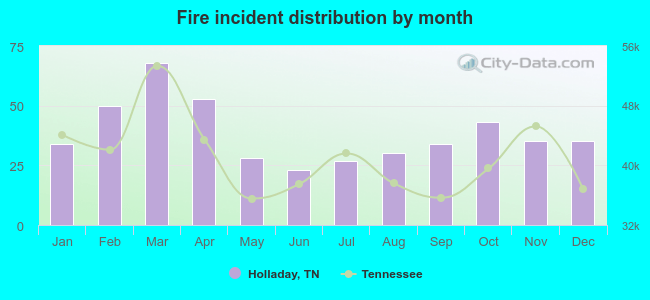 According to the 460 fire incident reports from years 2002 - 2018 most fires (14.8%) took place during March, and the least (5.0%) in June.
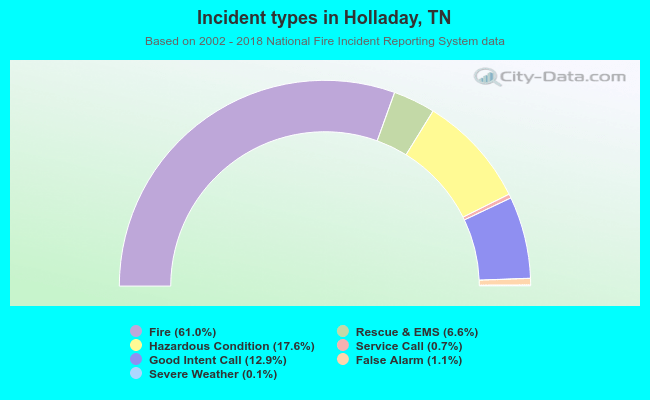 Out of all 754 cases reported during the years 2002 - 2018, the most belonged to the categories: Fire (61.0%), Rescue & EMS (17.6%), and Service Call (12.9%).
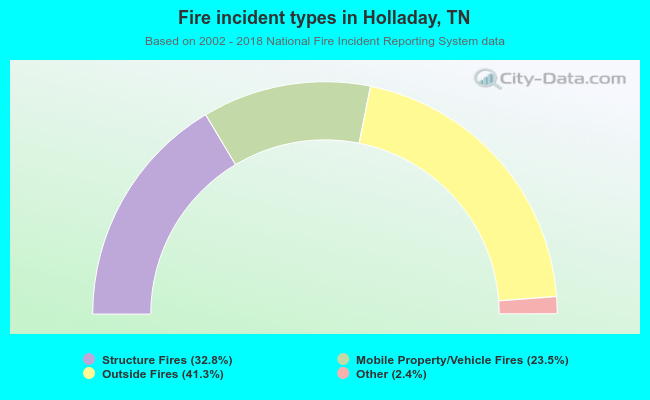 When looking into fire subcategories, the most incidents belonged to: Outside Fires (41.3%), and Structure Fires (32.8%).