Hornbeak: Fire Incidents, Tennessee (TN)
Where are fire incidents reported in Hornbeak, TN
Something went wrong! Please refresh the page.
|
| |||||||||||||||||||||||||||||||||||||||||||||||||||||||||||||||||||||||||||||||||||||||||||||||||||||||||||||
2004 - 2018 National Fire Incident Reporting System (NFIRS) incidents
- Incident types reported to NFIRS in Hornbeak, TN
- 36251.3%Fire
- 28039.7%Rescue & EMS
- 243.4%Special Incident
- 142.0%Hazardous Condition
- 111.6%Service Call
- 71.0%Good Intent Call
- 40.6%False Alarm
- 40.6%Severe Weather
- Fire incident types reported to NFIRS in Hornbeak, TN
- 18952.2%Structure Fires
- 13537.3%Outside Fires
- 298.0%Mobile Property/Vehicle Fires
- 92.5%Other
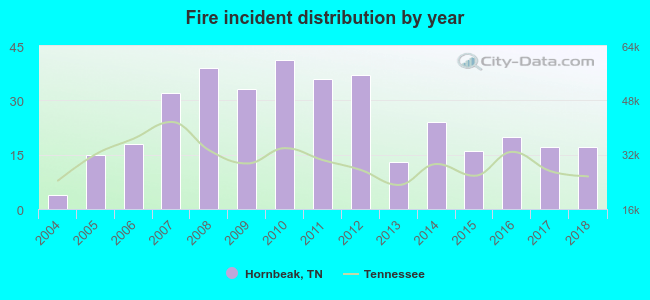 Based on the data from the years 2004 - 2018 the average number of fires per year is 24. The highest number of reported fires - 41 took place in 2010, and the least - 4 in 2004. The data has a rising trend.
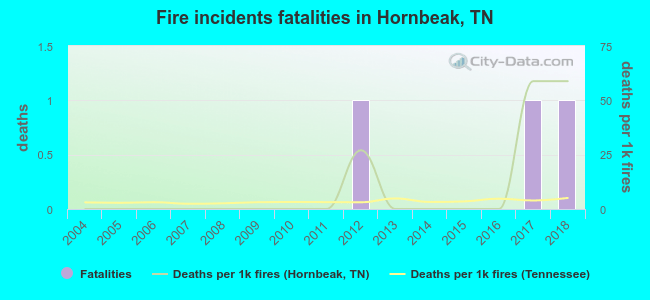 According to the data from the years 2004 - 2018 the average number of fire-related fatalities per year is 0. The highest number of deaths - 1 took place in 2012, and the lowest - 0 in 2004. The data has a rising trend.
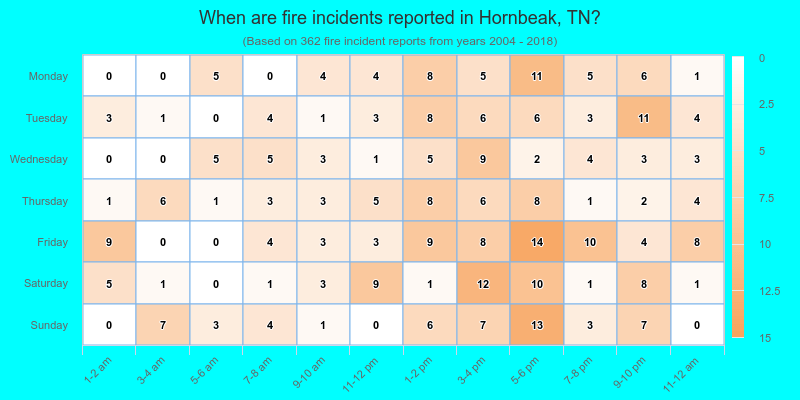
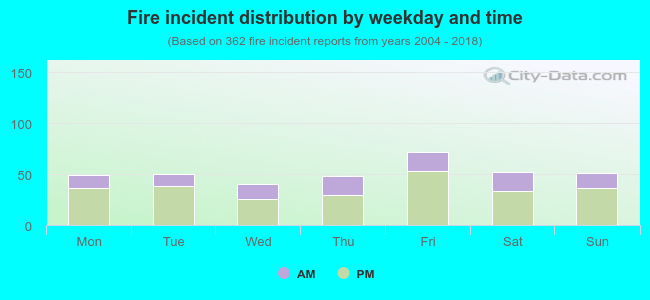 30.7% incidents where reported in the morning and 69.3% in the evening. The most fires (19.9%) took place on Friday, and the least (11.0%) on Wednesday.
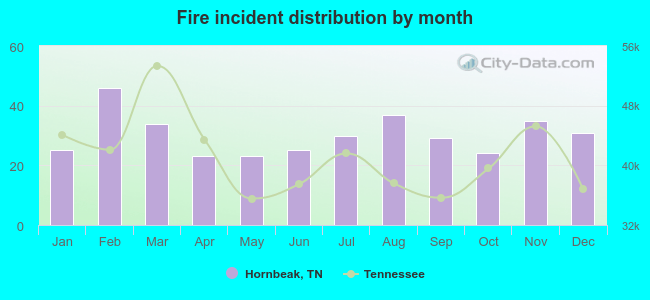 According to the 362 fires from years 2004 - 2018 most fires (12.7%) took place during February, and the least (6.4%) in April.
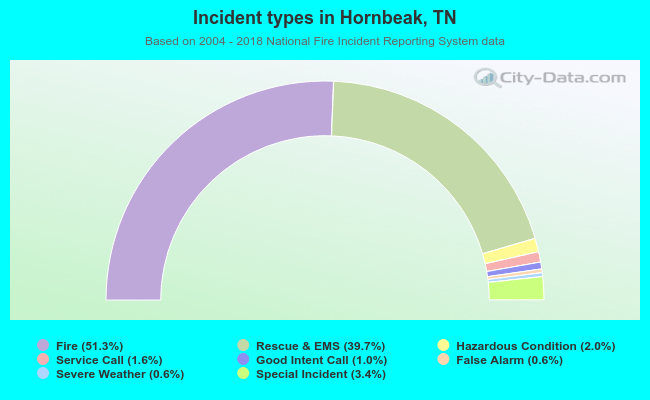 Out of all 706 cases reported during the years 2004 - 2018, the most belonged to the categories: Fire (51.3%), Overpressure Rupture (39.7%), and Severe Weather (3.4%).
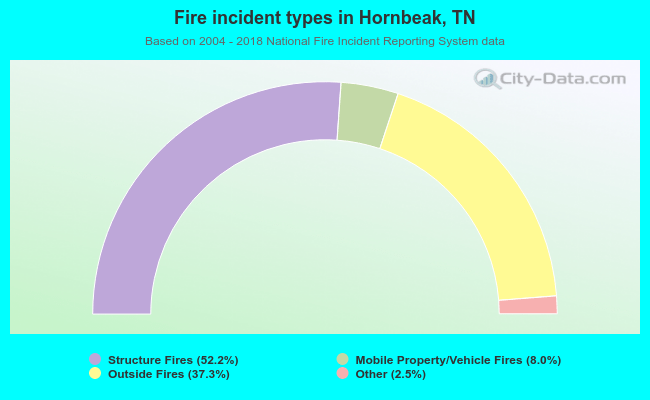 When looking into fire subcategories, the most incidents belonged to: Structure Fires (52.2%), and Outside Fires (37.3%).