| Fire incidents reported |
|---|
| Sreet name | Count |
|---|
| HUBBARD LAKE RD | 26 | | WOLF CREEK RD | 16 | | MT MARIA ROAD | 14 | | HUBBARD LAKE ROAD | 12 | | MT MARIA RD | 12 | | NICHOLSON HILL RD | 12 | | HUBBARD LAKE TRL | 10 | | SCOTT ROAD | 10 | | HUBBARD LAKE | 8 | | RATZ RD | 8 | | SCOTT RD | 8 | | BEAVER LAKE RD | 6 | | HUBERT | 6 | | HUBERT RD | 6 | | NICHOLSON HILL ROAD | 6 | | WOLF CREEK ROAD | 6 | | BEAR SPRINGS RD | 4 | | BEAUDION RD | 4 | | BEAVER LAKE ROAD | 4 | | BORKE ROAD | 4 | | HUBERT ROAD | 4 | | HUBERT ROAD | 4 | | KLEVE RD | 4 | | MT MARIA ROAD | 4 | | MT. MARIA ROAD | 4 |
| | | Fire incidents reported |
|---|
| Sreet name | Count |
|---|
| NICHOLSON HILL RD | 4 | | SCOTT ROAD | 4 | | 10592 HUBBARD LAKE ROAD | 2 | | 10760 BUSKEY ROAD | 2 | | 11240 HUBBARD LAKE ROAD | 2 | | 11624 HUBBARD LAKE ROAD | 2 | | 13816 HUBBARD LAKE ROAD | 2 | | 13819 HUBBARD LAKE ROAD | 2 | | 14059 HUBBARD LAKE ROAD | 2 | | 14502 HUBBARD LAKE ROAD | 2 | | 2339 HUBERT ROAD | 2 | | 2634 HUBBARD LAKE TRAIL | 2 | | 3 RD STRE | 2 | | 3RD ST | 2 | | 4250 UNION STREET | 2 | | 5212 RATZ ROAD | 2 | | 5561 SCOTT ROAD | 2 | | 5765 RAZT ROAD | 2 | | 5910 SCOTT ROAD | 2 | | 5982 HUBBARD LAKE ROAD | 2 | | 6600 HIDDEN LAKE | 2 | | 6690 NICHOLSON HILL RD | 2 | | 6754 INDIAN RESERVE ROAD | 2 | | 6865 STOUT ROAD | 2 | | |
|
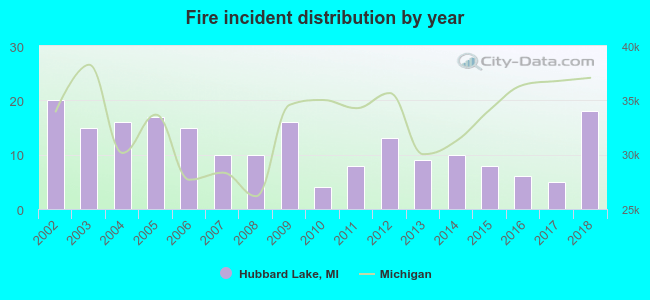 Based on the data from the years 2002 - 2018 the average number of fires per year is 12. The highest number of fires - 20 took place in 2002, and the least - 4 in 2010. The data has a decreasing trend.
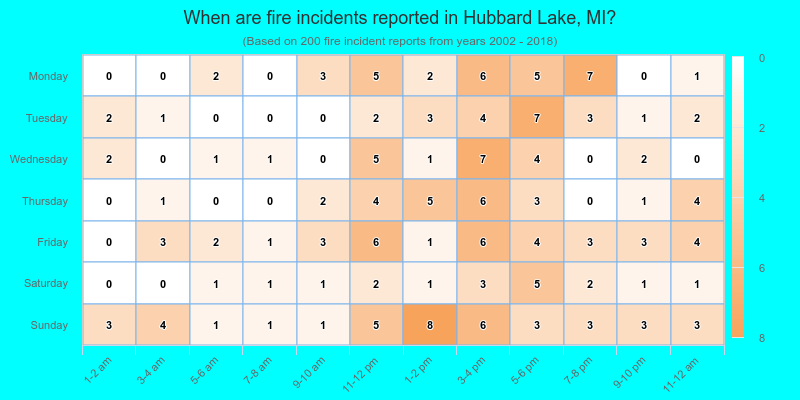
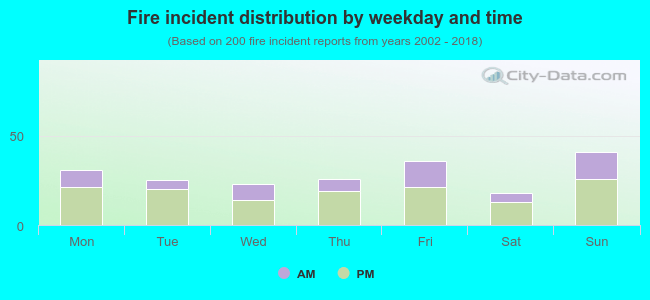 33.0% incidents where reported in the morning and 67.0% in the evening. The most fires (20.5%) took place on Sunday, and the least (9.0%) on Saturday.
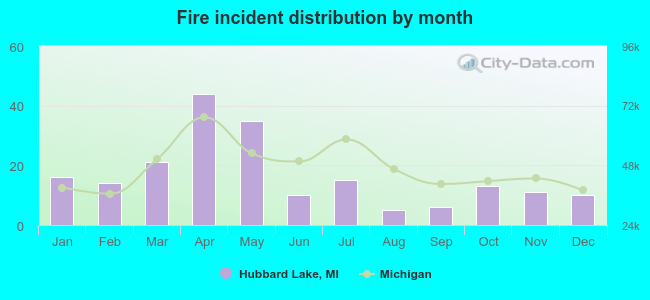 Based on the 200 fire incident reports from years 2002 - 2018 most fires (22.0%) took place during April, and the least (2.5%) in August.
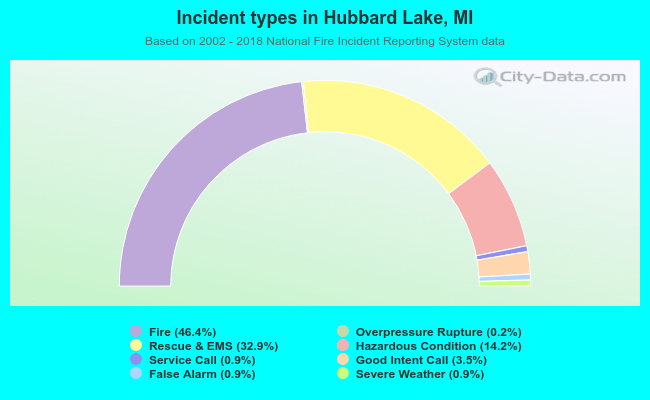 Out of all 431 cases reported during the years 2002 - 2018, the most belonged to the categories: Fire (46.4%), Rescue & EMS (32.9%), and Hazardous Condition (14.2%).
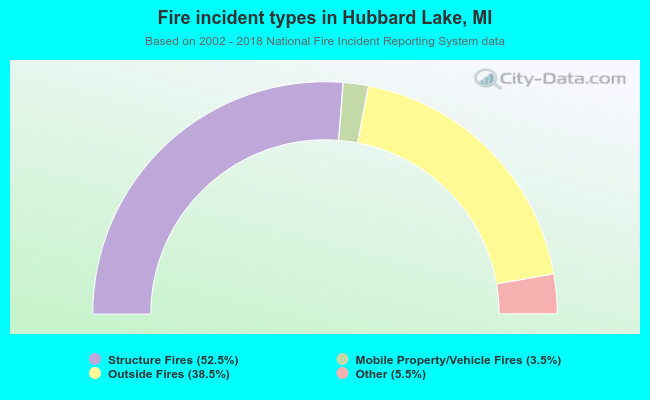 When looking into fire subcategories, the most reports belonged to: Structure Fires (52.5%), and Outside Fires (38.5%).