Huron: Fire Incidents, South Dakota (SD)
Where are fire incidents reported in Huron, SD
Something went wrong! Please refresh the page.
|
| |||||||||||||||||||||||||||||||||||||||||||||||||||||||||||||||||||||||||||||||||||||||||||||||||||||||||||||
| Other | 270 | |||||||||||||||||||||||||||||||||||||||||||||||||||||||||||||||||||||||||||||||||||||||||||||||||||||||||||||
2008 - 2018 National Fire Incident Reporting System (NFIRS) incidents
- Incident types reported to NFIRS in Huron, SD
- 40249.4%Fire
- 21326.2%Hazardous Condition
- 11814.5%False Alarm
- 354.3%Good Intent Call
- 222.7%Rescue & EMS
- 182.2%Service Call
- 30.4%Special Incident
- 20.2%Overpressure Rupture
- Fire incident types reported to NFIRS in Huron, SD
- 12932.1%Structure Fires
- 11328.1%Outside Fires
- 9122.6%Other
- 6917.2%Mobile Property/Vehicle Fires
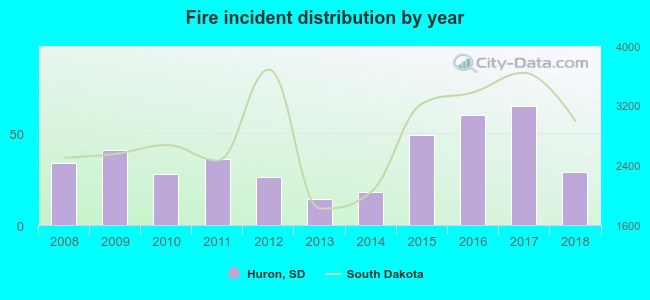 According to the data from the years 2008 - 2018 the average number of fires per year is 36. The highest number of fire incidents - 65 took place in 2017, and the least - 14 in 2013. The data has a declining trend.
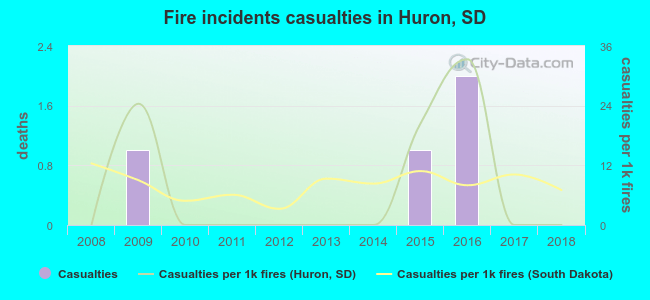 Based on the reports from the years 2008 - 2018 the average number of fire-related casualties per year is 0. The highest number of injuries - 2 took place in 2016, and the lowest - 0 in 2008. The data has a constant trend.
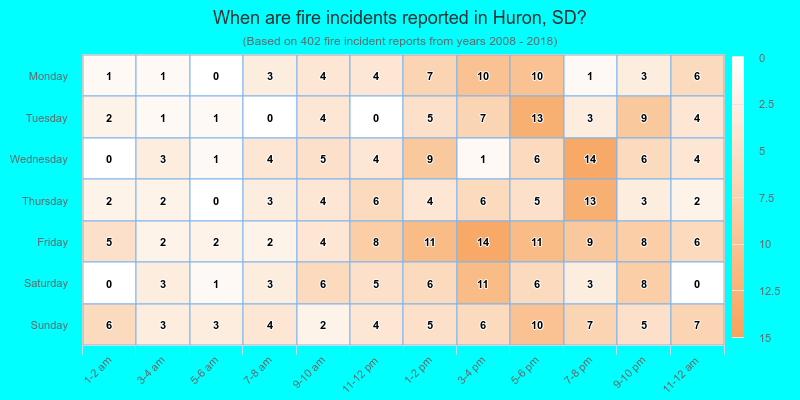
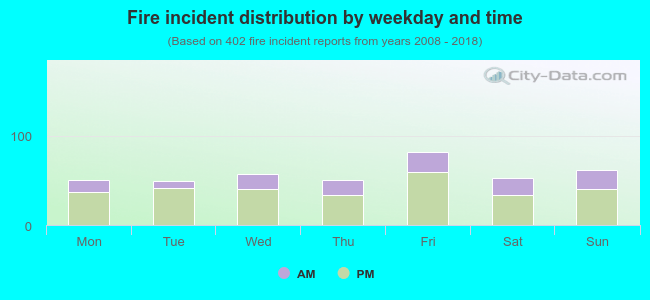 29.4% incidents where reported in the morning and 70.6% in the evening. The most fires (20.4%) took place on Friday, and the least (12.2%) on Tuesday.
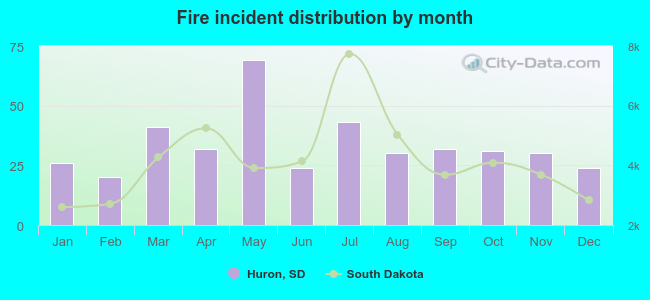 Based on the 402 fire incident reports from years 2008 - 2018 most fires (17.2%) took place during May, and the least (5.0%) in February.
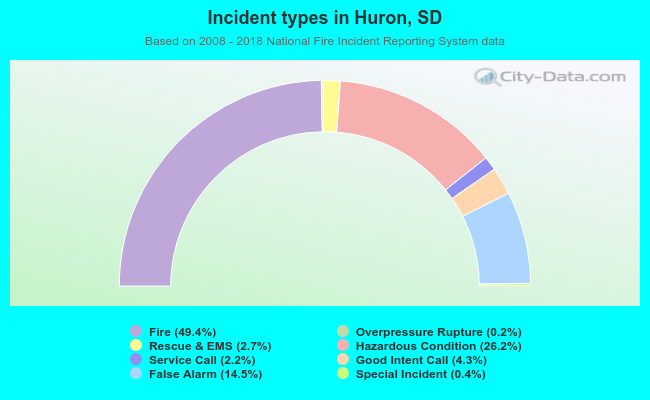 Out of all 813 cases reported during the years 2008 - 2018, the most belonged to the categories: Fire (49.4%), Hazardous Condition (26.2%), and False Alarm (14.5%).
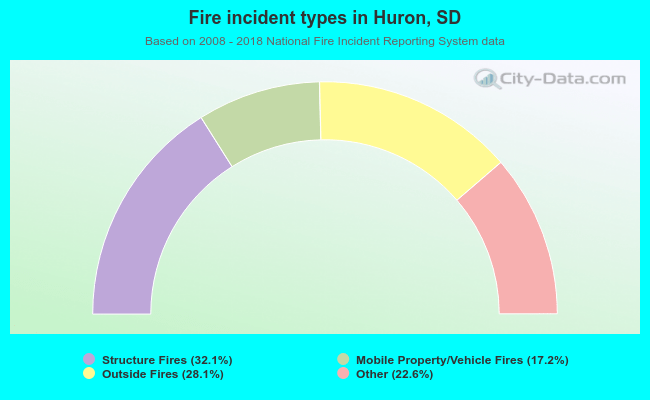 When looking into fire subcategories, the most reports belonged to: Structure Fires (32.1%), and Outside Fires (28.1%).