Hyde Park: Fire Incidents, Utah (UT)
Where are fire incidents reported in Hyde Park, UT
Something went wrong! Please refresh the page.
|
| |||||||||||||||||||||||||||||||||||||||||||||||||||||||||||||||||||||||||||||||||||||||||||||||||||||||||||||
2002 - 2018 National Fire Incident Reporting System (NFIRS) incidents
- Incident types reported to NFIRS in Hyde Park, UT
- 39259.5%Rescue & EMS
- 12018.2%Fire
- 7511.4%Hazardous Condition
- 446.7%Good Intent Call
- 192.9%False Alarm
- 50.8%Service Call
- 30.5%Special Incident
- 10.2%Overpressure Rupture
- Fire incident types reported to NFIRS in Hyde Park, UT
- 5445.0%Structure Fires
- 4134.2%Outside Fires
- 1815.0%Other
- 75.8%Mobile Property/Vehicle Fires
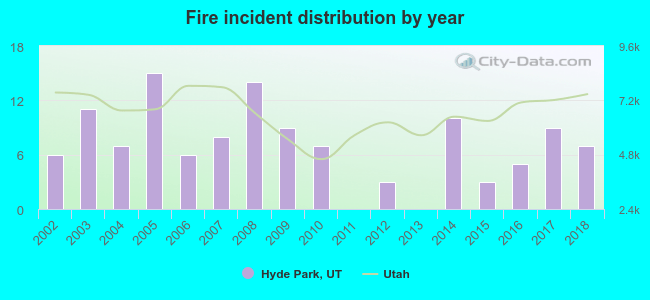 According to the data from the years 2002 - 2018 the average number of fires per year is 7. The highest number of reported fires - 15 took place in 2005, and the least - 0 in 2011. The data has a rising trend.
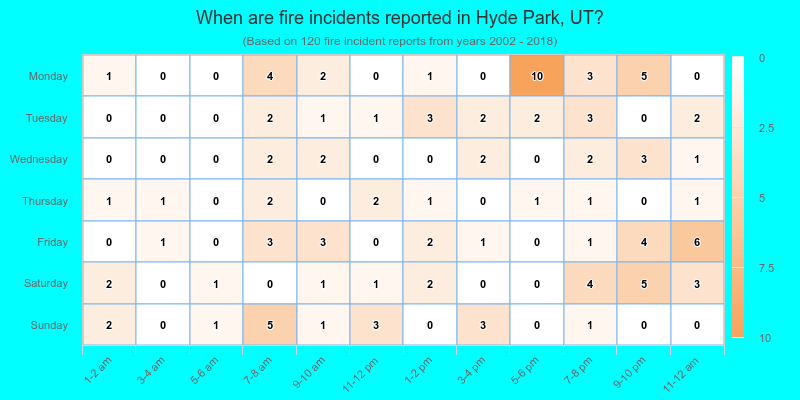
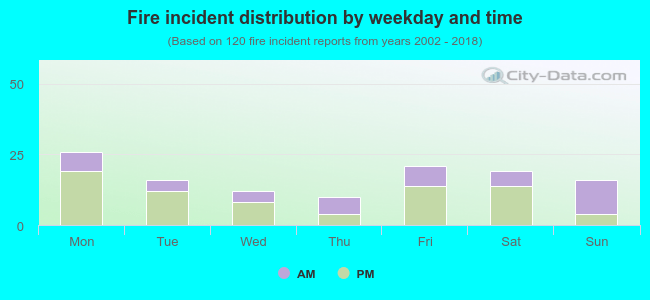 37.5% incidents where reported in the morning and 62.5% in the evening. The most fires (21.7%) took place on Monday, and the least (8.3%) on Thursday.
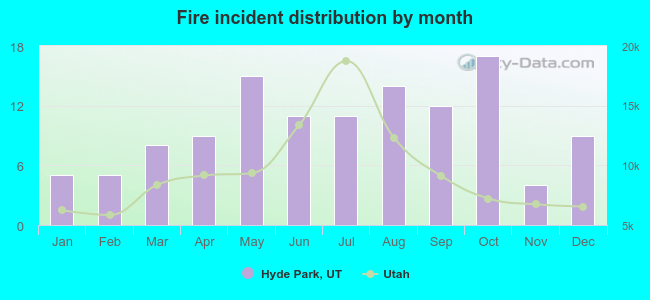 Based on the 120 fire incident reports from years 2002 - 2018 most fires (14.2%) took place during October, and the least (3.3%) in November.
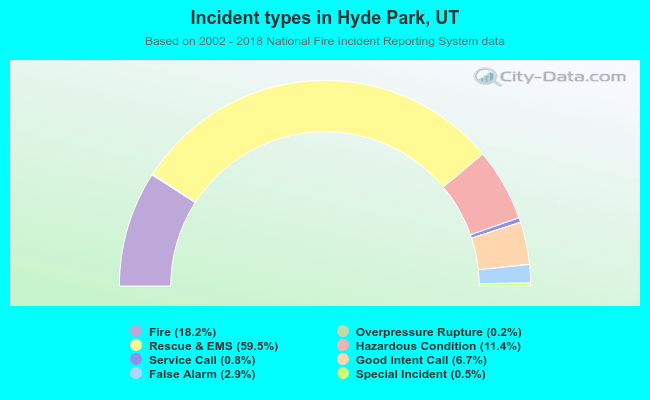 Out of all 659 cases reported during the years 2002 - 2018, the most belonged to the categories: Rescue & EMS (59.5%), Fire (18.2%), and Hazardous Condition (11.4%).
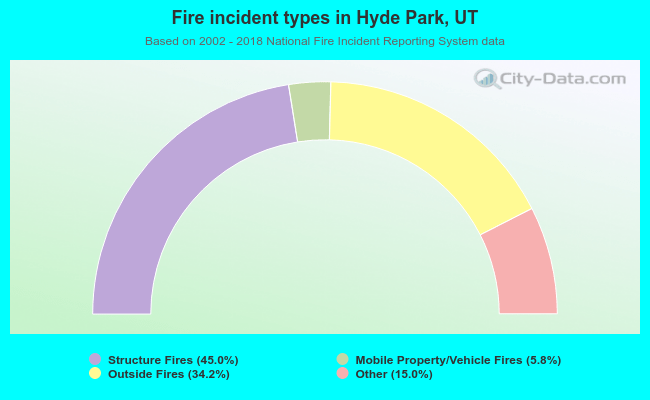 When looking into fire subcategories, the most reports belonged to: Structure Fires (45.0%), and Outside Fires (34.2%).