Inola: Fire Incidents, Oklahoma (OK)
Where are fire incidents reported in Inola, OK
Something went wrong! Please refresh the page.
|
| |||||||||||||||||||||||||||||||||||||||||||||||||||||||||||||||||||||||||||||||||||||||||||||||||||||||||||||
2002 - 2018 National Fire Incident Reporting System (NFIRS) incidents
- Incident types reported to NFIRS in Inola, OK
- 68442.6%Fire
- 65941.0%Rescue & EMS
- 1086.7%Good Intent Call
- 784.9%Hazardous Condition
- 402.5%False Alarm
- 322.0%Service Call
- 20.1%Overpressure Rupture
- 20.1%Severe Weather
- 20.1%Special Incident
- Fire incident types reported to NFIRS in Inola, OK
- 47068.7%Outside Fires
- 13219.3%Structure Fires
- 7811.4%Mobile Property/Vehicle Fires
- 40.6%Other
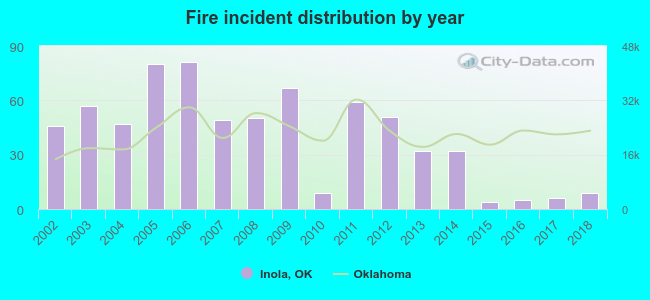 Based on the data from the years 2002 - 2018 the average number of fires per year is 40. The highest number of fire incidents - 81 took place in 2006, and the least - 4 in 2015. The data has a declining trend.
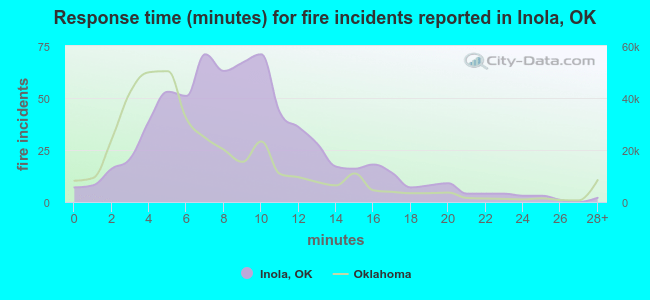 The median response time based on all reported fire incidents is 9 minutes. This is higher than the state median value.
The median response time in Inola, OK compared to nearest cities:
(Note: Based on data for all years, including only cities with at least 500 fire incidents)
| Inola: | 9 minutes |
| Chouteau: | 4 minutes |
| Claremore: | 6 minutes |
| Catoosa: | 7 minutes |
| Coweta: | 6 minutes |
| Wagoner: | 4 minutes |
| Broken Arrow: | 6 minutes |
| Owasso: | 5 minutes |
| Locust Grove: | 7 minutes |
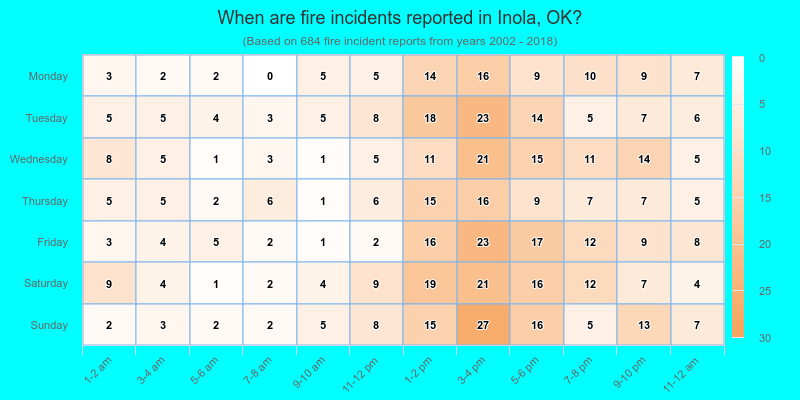
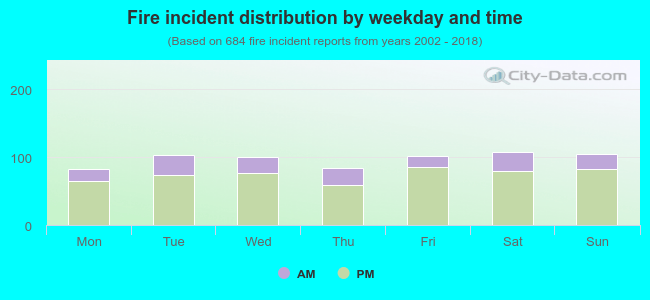 23.8% incidents where reported in the morning and 76.2% in the evening. The most fires (15.8%) took place on Saturday, and the least (12.0%) on Monday.
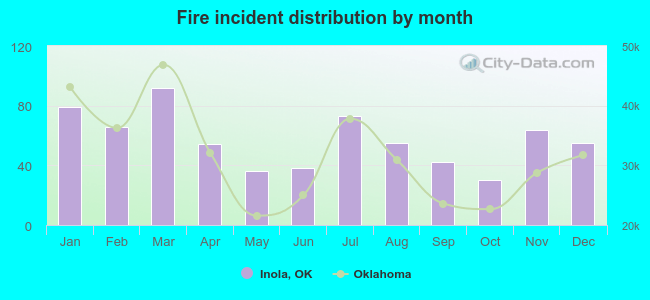 Based on the 684 fire incidents from years 2002 - 2018 most fires (13.5%) took place during March, and the least (4.4%) in October.
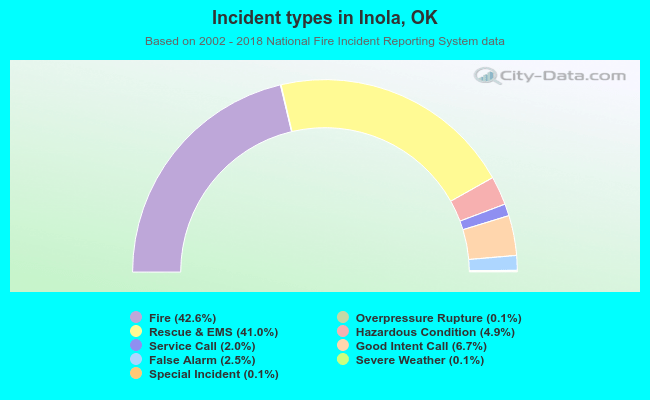 Out of all 1,607 cases reported during the years 2002 - 2018, the most belonged to the categories: Fire (42.6%), Rescue & EMS (41.0%), and Good Intent Call (6.7%).
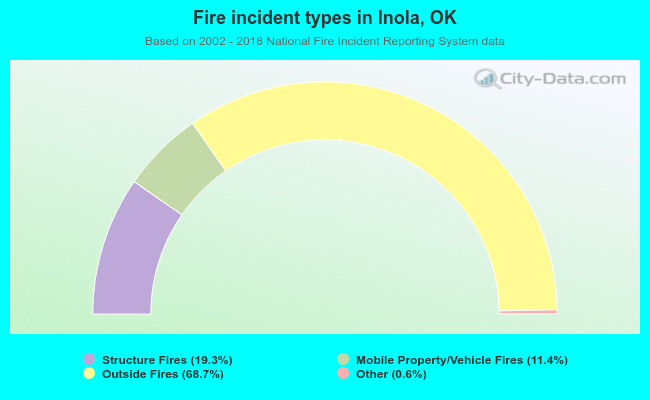 When looking into fire subcategories, the most reports belonged to: Outside Fires (68.7%), and Structure Fires (19.3%).