Italy: Fire Incidents, Texas (TX)
Where are fire incidents reported in Italy, TX
Something went wrong! Please refresh the page.
|
| |||||||||||||||||||||||||||||||||||||||||||||||||||||||||||||||||||||||||||||||||||||||||||||||||||||||||||||
2002 - 2018 National Fire Incident Reporting System (NFIRS) incidents
- Incident types reported to NFIRS in Italy, TX
- 50833.0%Rescue & EMS
- 46230.0%Fire
- 24916.2%Hazardous Condition
- 1399.0%Good Intent Call
- 1258.1%Service Call
- 332.1%False Alarm
- 151.0%Severe Weather
- 40.3%Special Incident
- 30.2%Overpressure Rupture
- Fire incident types reported to NFIRS in Italy, TX
- 24753.5%Outside Fires
- 12326.6%Structure Fires
- 6714.5%Mobile Property/Vehicle Fires
- 255.4%Other
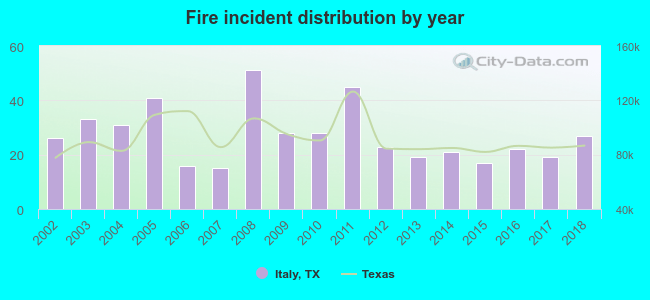 Based on the data from the years 2002 - 2018 the average number of fires per year is 27. The highest number of fires - 51 took place in 2008, and the least - 15 in 2007. The data has an increasing trend.
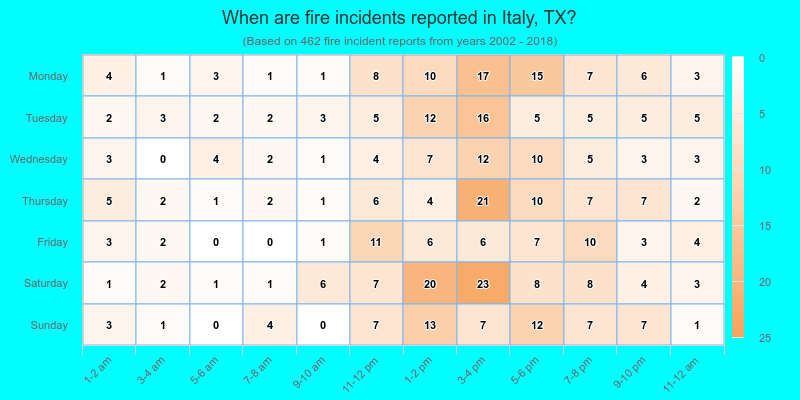
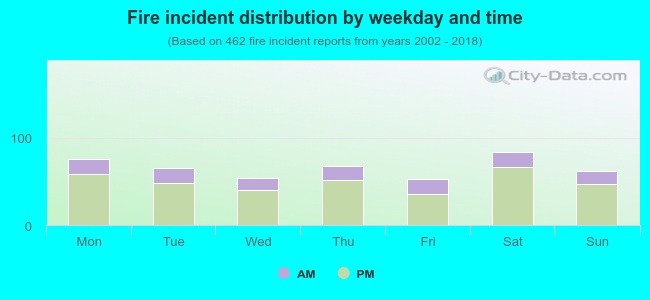 25.1% incidents where reported in the morning and 74.9% in the evening. The most fires (18.2%) took place on Saturday, and the least (11.5%) on Friday.
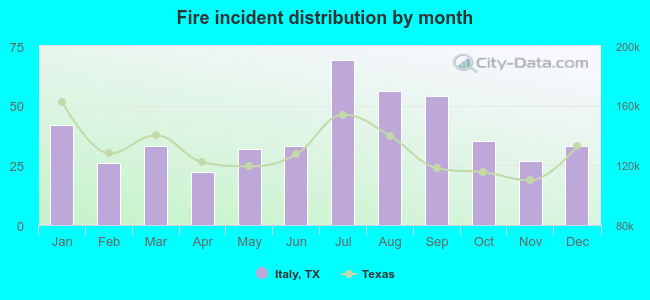 According to the 462 fire incident reports from years 2002 - 2018 most fires (14.9%) took place during July, and the least (4.8%) in April.
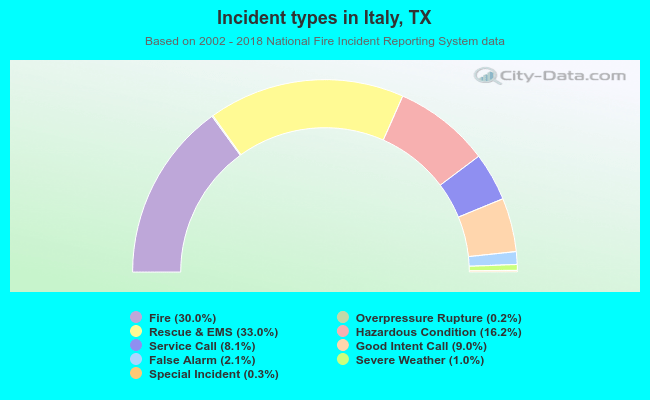 Out of all 1,538 cases reported during the years 2002 - 2018, the most belonged to the categories: Rescue & EMS (33.0%), Fire (30.0%), and Hazardous Condition (16.2%).
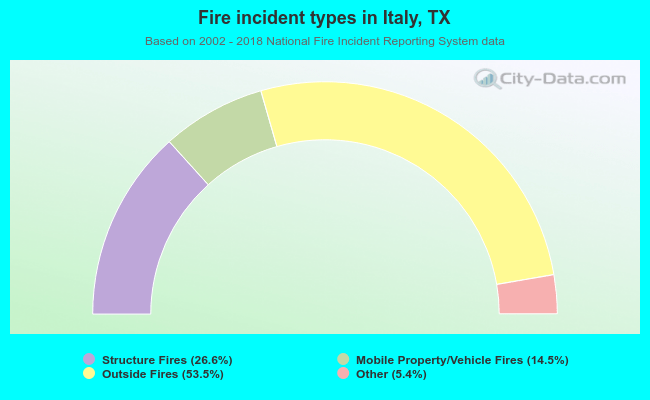 When looking into fire subcategories, the most reports belonged to: Outside Fires (53.5%), and Structure Fires (26.6%).