Ivins: Fire Incidents, Utah (UT)
Where are fire incidents reported in Ivins, UT
Something went wrong! Please refresh the page.
|
| |||||||||||||||||||||||||||||||||||||||||||||||||||||||||||||||||||||||||||||||||||||||||||||||||||||||||||||
2002 - 2018 National Fire Incident Reporting System (NFIRS) incidents
- Incident types reported to NFIRS in Ivins, UT
- 2,07060.6%Rescue & EMS
- 44813.1%Service Call
- 3259.5%Good Intent Call
- 2738.0%Fire
- 1374.0%False Alarm
- 1153.4%Hazardous Condition
- 270.8%Overpressure Rupture
- 190.6%Severe Weather
- 40.1%Special Incident
- Fire incident types reported to NFIRS in Ivins, UT
- 14051.3%Outside Fires
- 7828.6%Structure Fires
- 2910.6%Other
- 269.5%Mobile Property/Vehicle Fires
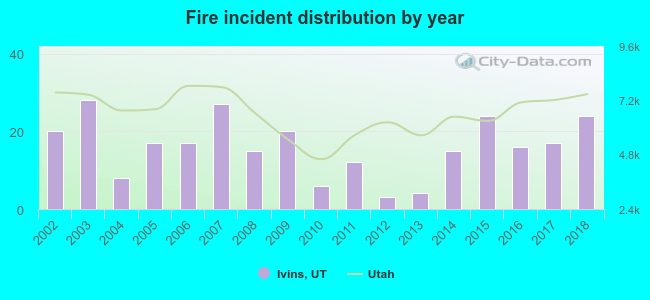 According to the data from the years 2002 - 2018 the average number of fires per year is 16. The highest number of reported fires - 28 took place in 2003, and the least - 3 in 2012. The data has a rising trend.
The average number of yearly fire incidents per 10k residents in Ivins, UT compared to nearest cities:
(Note: Based on data for the last 3 years, including only cities with population 5,000 and above)
| Ivins: | 24.8 |
| Santa Clara: | 23.0 |
| Washington: | 11.1 |
| Hurricane: | 43.5 |
| Cedar City: | 27.7 |
| Enoch: | 21.3 |
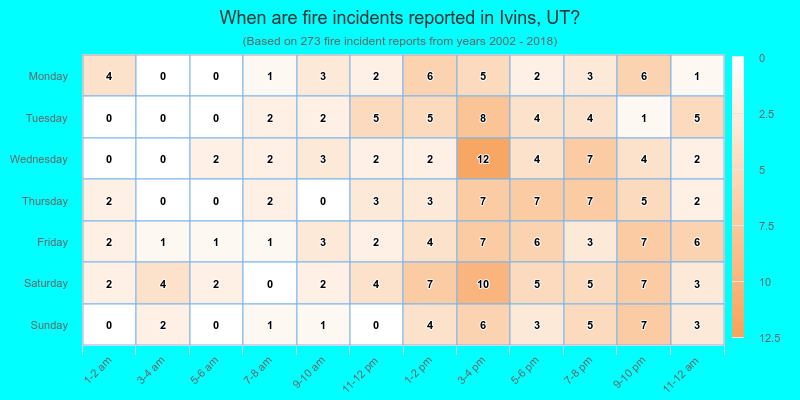
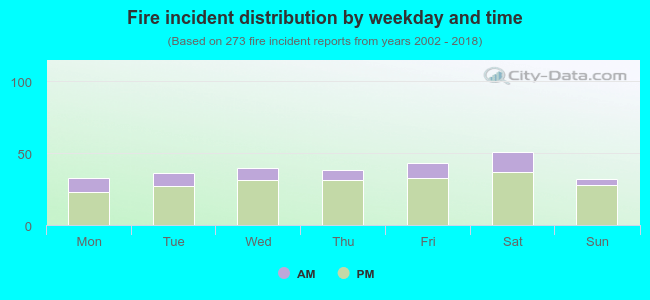 23.1% incidents where reported in the morning and 76.9% in the evening. The most fires (18.7%) took place on Saturday, and the least (11.7%) on Sunday.
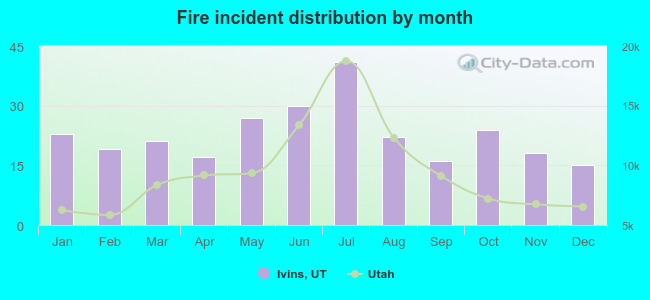 Based on the 273 fire incident reports from years 2002 - 2018 most fires (15.0%) took place during July, and the least (5.5%) in December.
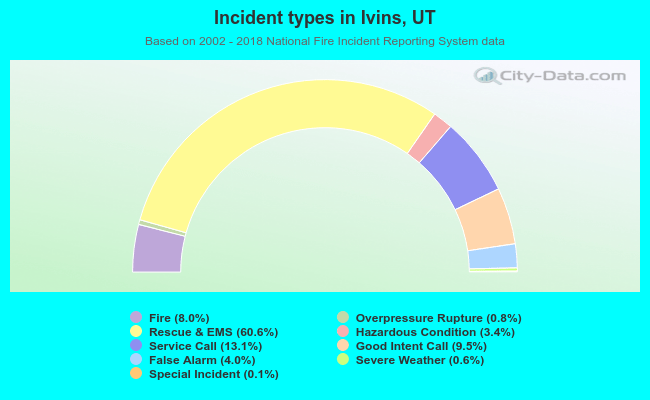 Out of all 3,418 cases reported during the years 2002 - 2018, the most belonged to the categories: Rescue & EMS (60.6%), Service Call (13.1%), and Good Intent Call (9.5%).
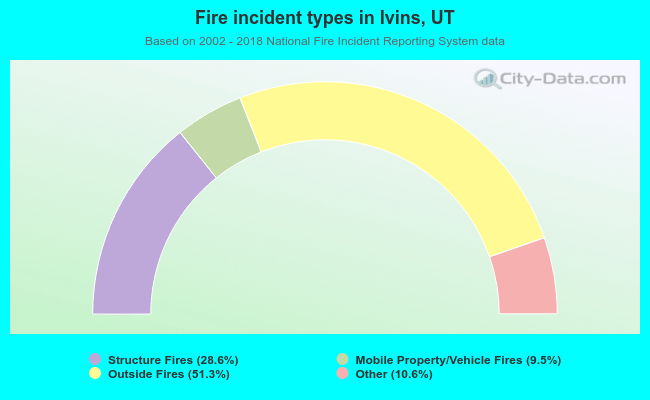 When looking into fire subcategories, the most reports belonged to: Outside Fires (51.3%), and Structure Fires (28.6%).