Johnston: Fire Incidents, Rhode Island (RI)
Where are fire incidents reported in Johnston, RI
Something went wrong! Please refresh the page.
|
| |||||||||||||||||||||||||||||||||||||||||||||||||||||||||||||||||||||||||||||||||||||||||||||||||||||||||||||
2003 - 2018 National Fire Incident Reporting System (NFIRS) incidents
- Incident types reported to NFIRS in Johnston, RI
- 7,94673.7%Rescue & EMS
- 9989.3%False Alarm
- 5515.1%Good Intent Call
- 5194.8%Service Call
- 3763.5%Fire
- 3573.3%Hazardous Condition
- 190.2%Special Incident
- 140.1%Overpressure Rupture
- Fire incident types reported to NFIRS in Johnston, RI
- 18047.9%Outside Fires
- 9926.3%Structure Fires
- 5414.4%Mobile Property/Vehicle Fires
- 4311.4%Other
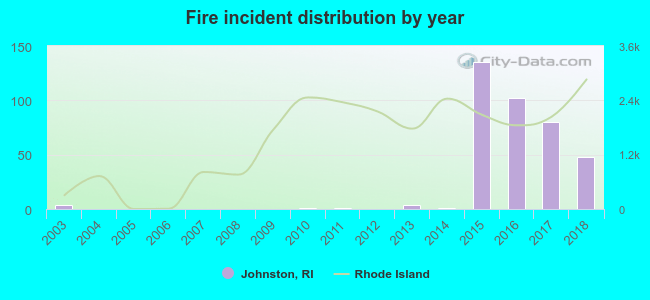 According to the data from the years 2003 - 2018 the average number of fire incidents per year is 24. The highest number of fires - 135 took place in 2015, and the least - 0 in 2004. The data has a growing trend.
The average number of yearly fire incidents per 10k residents in Johnston, RI compared to nearest cities:
(Note: Based on data for the last 3 years, including only cities with population 5,000 and above)
| Johnston: | 26.6 |
| Providence: | 4.8 |
| Cranston: | 25.6 |
| Smithfield: | 27.7 |
| Scituate: | 3.9 |
| Central Falls: | 96.2 |
| Pawtucket: | 0.3 |
| East Providence: | 21.7 |
| Lincoln: | 31.0 |
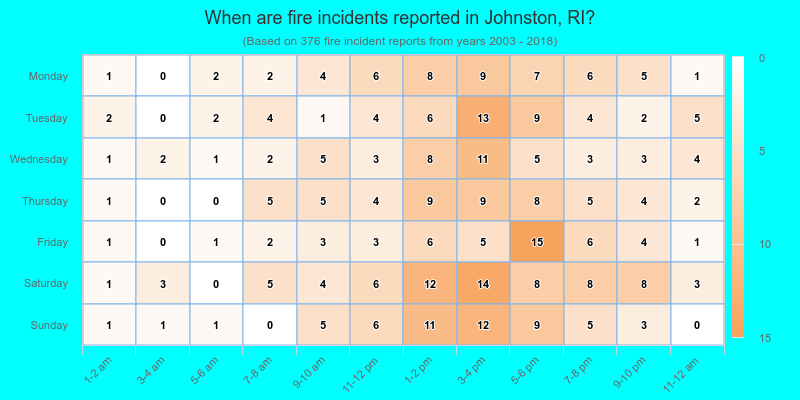
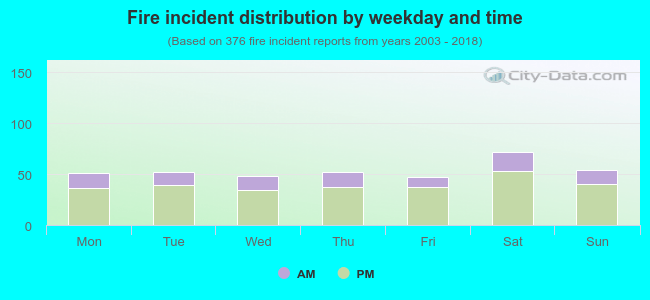 26.6% incidents where reported in the morning and 73.4% in the evening. The most fires (19.1%) took place on Saturday, and the least (12.5%) on Friday.
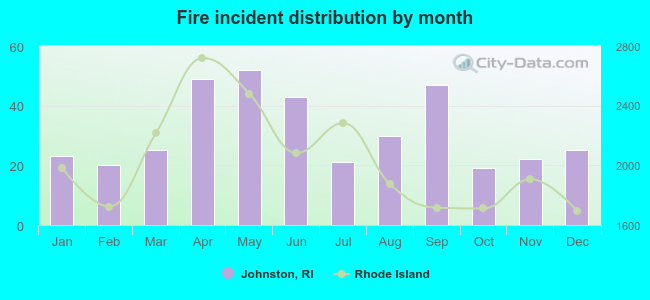 According to the 376 fire incidents from years 2003 - 2018 most fires (13.8%) took place during May, and the least (5.1%) in October.
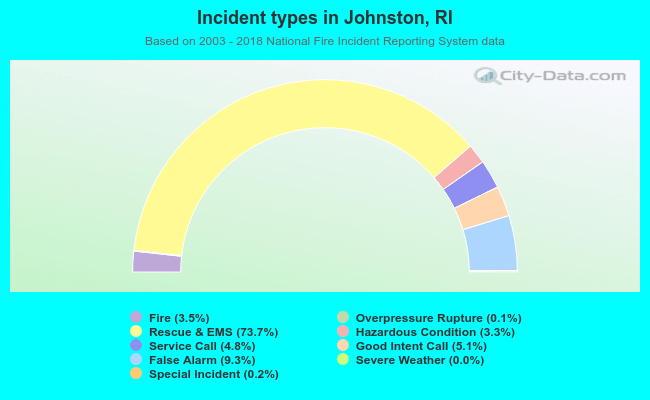 Out of all 10,782 cases reported during the years 2003 - 2018, the most belonged to the categories: Rescue & EMS (73.7%), False Alarm (9.3%), and Good Intent Call (5.1%).
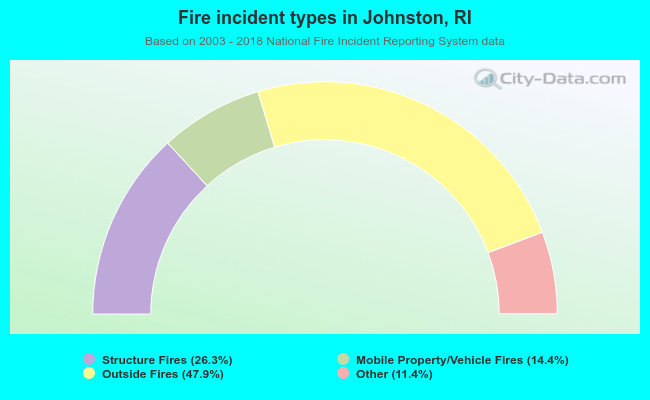 When looking into fire subcategories, the most incidents belonged to: Outside Fires (47.9%), and Structure Fires (26.3%).