Johnstown: Fire Incidents, Colorado (CO)
Where are fire incidents reported in Johnstown, CO
Something went wrong! Please refresh the page.
|
| |||||||||||||||||||||||||||||||||||||||||||||||||||||||||||||||||||||||||||||||||||||||||||||||||||||||||||||
2004 - 2018 National Fire Incident Reporting System (NFIRS) incidents
- Incident types reported to NFIRS in Johnstown, CO
- 3,08051.3%Rescue & EMS
- 1,12818.8%Good Intent Call
- 64110.7%Fire
- 4397.3%Hazardous Condition
- 3766.3%False Alarm
- 3295.5%Service Call
- Fire incident types reported to NFIRS in Johnstown, CO
- 41464.6%Outside Fires
- 12018.7%Structure Fires
- 8513.3%Mobile Property/Vehicle Fires
- 223.4%Other
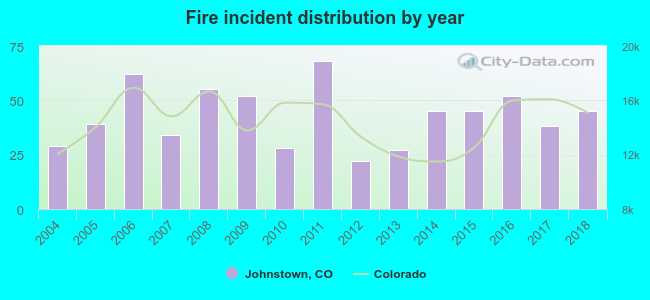 According to the data from the years 2004 - 2018 the average number of fire incidents per year is 43. The highest number of reported fire incidents - 68 took place in 2011, and the least - 22 in 2012. The data has a rising trend.
The average number of yearly fire incidents per 10k residents in Johnstown, CO compared to nearest cities:
(Note: Based on data for the last 3 years, including only cities with population 5,000 and above)
| Johnstown: | 33.8 |
| Milliken: | 36.7 |
| Berthoud: | 96.4 |
| Windsor: | 20.8 |
| Loveland: | 23.6 |
| Evans: | 35.8 |
| Greeley: | 21.7 |
| Firestone: | 34.4 |
| Longmont: | 28.6 |
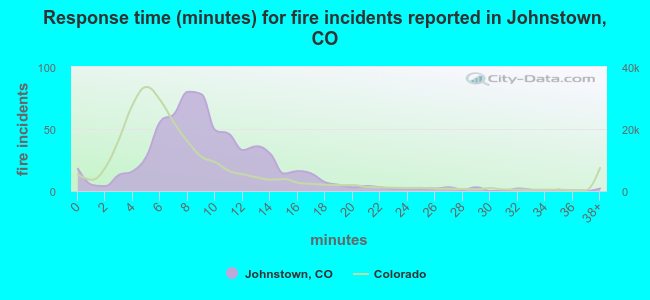 The median response time based on all reported fire incidents is 9 minutes. This is higher than the Colorado median value.
The median response time in Johnstown, CO compared to nearest cities:
(Note: Based on data for all years, including only cities with at least 500 fire incidents)
| Johnstown: | 9 minutes |
| Berthoud: | 9 minutes |
| Windsor: | 7 minutes |
| Platteville: | 9 minutes |
| Loveland: | 6 minutes |
| Evans: | 6 minutes |
| Greeley: | 7 minutes |
| Longmont: | 7 minutes |
| Eaton: | 8 minutes |
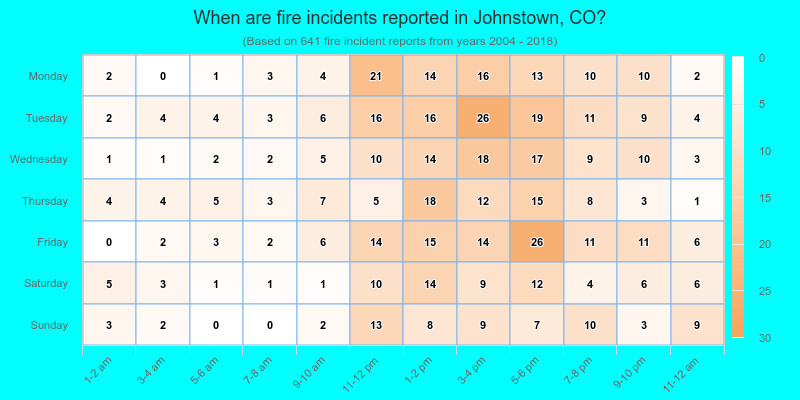
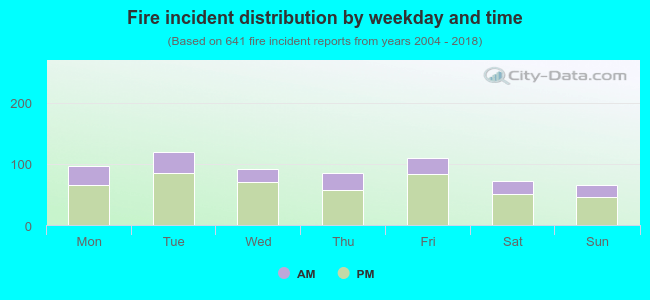 28.5% incidents where reported in the morning and 71.5% in the evening. The most fires (18.7%) took place on Tuesday, and the least (10.3%) on Sunday.
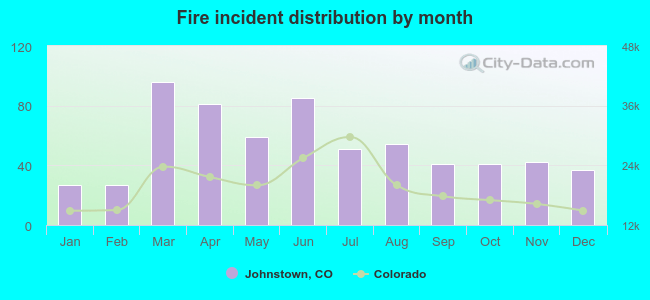 According to the 641 incident reports from years 2004 - 2018 most fires (15.0%) took place during March, and the least (4.2%) in January.
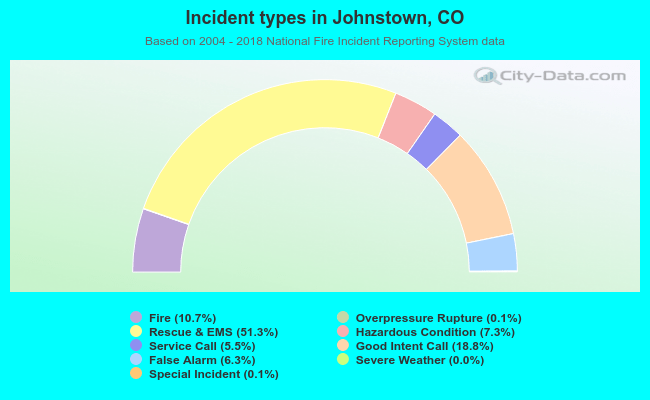 Out of all 6,005 cases reported during the years 2004 - 2018, the most belonged to the categories: Rescue & EMS (51.3%), Good Intent Call (18.8%), and Fire (10.7%).
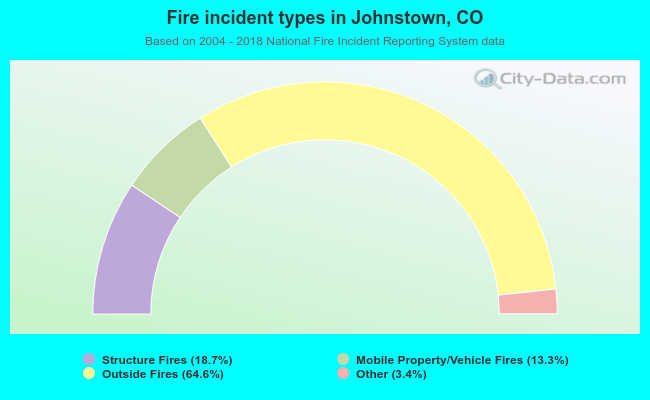 When looking into fire subcategories, the most reports belonged to: Outside Fires (64.6%), and Structure Fires (18.7%).