Kenosha: Fire Incidents, Wisconsin (WI)
Where are fire incidents reported in Kenosha, WI
Something went wrong! Please refresh the page.
| Fire incidents reported | |
|---|---|
| Sreet name | Count |
| 75TH (STH 50) ST | 90 |
| 75TH ST | 56 |
| SHERIDAN RD | 56 |
| 60TH ST | 54 |
| SHERIDAN ROAD | 52 |
| 22ND AVE | 46 |
| 88TH AVE | 32 |
| GREEN BAY RD | 32 |
| 52ND ST | 30 |
| 7TH AVE | 26 |
| 14TH AVE | 24 |
| INTERSTATE 94 | 20 |
| 17TH AVE | 18 |
| 32ND AVE | 18 |
| 38TH ST | 18 |
| 39TH AVE | 18 |
| 24TH AVE | 16 |
| 25TH AVE | 16 |
| 36TH AVE | 16 |
| 42ND AVE | 16 |
| COOPER RD | 16 |
| 120TH AVE | 14 |
| 38TH STREET | 14 |
| 50TH ST | 14 |
| 55TH ST | 14 |
| 59TH ST | 14 |
| 62ND ST | 14 |
| 63RD ST | 14 |
| 82ND ST | 14 |
| 89TH ST | 14 |
| Other | 574 |
2002 - 2018 National Fire Incident Reporting System (NFIRS) incidents
- Incident types reported to NFIRS in Kenosha, WI
- 33,56676.3%Rescue & EMS
- 3,0587.0%Hazardous Condition
- 2,3265.3%Service Call
- 2,2085.0%False Alarm
- 1,3703.1%Fire
- 1,3603.1%Good Intent Call
- 630.1%Special Incident
- Fire incident types reported to NFIRS in Kenosha, WI
- 61645.0%Structure Fires
- 38728.2%Outside Fires
- 24718.0%Mobile Property/Vehicle Fires
- 1208.8%Other
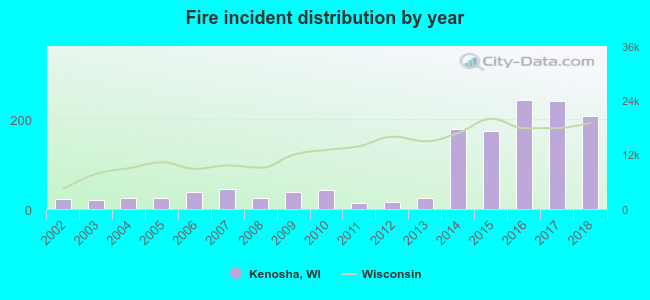 According to the data from the years 2002 - 2018 the average number of fire incidents per year is 81. The highest number of fire incidents - 242 took place in 2016, and the least - 14 in 2011. The data has a rising trend.
The average number of yearly fire incidents per 10k residents in Kenosha, WI compared to nearest cities:
(Note: Based on data for the last 3 years, including only cities with population 5,000 and above)
| Kenosha: | 23.0 |
| Somers: | 39.9 |
| Pleasant Prairie: | 20.6 |
| Sturtevant: | 43.0 |
| Mount Pleasant: | 8.9 |
| Racine: | 33.7 |
| Caledonia: | 8.1 |
| Salem: | 27.3 |
| Oak Creek: | 30.0 |
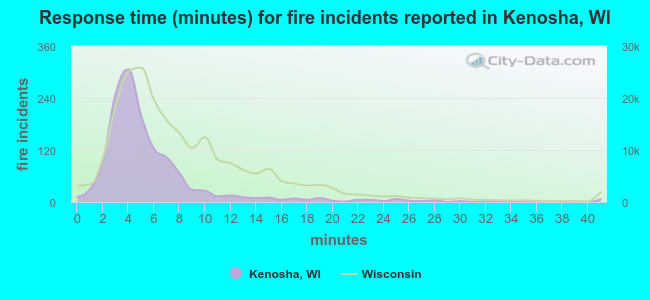 The median response time based on all reported fire incidents is 4 minutes. This is lower than the state median value.
The median response time in Kenosha, WI compared to nearest cities:
(Note: Based on data for all years, including only cities with at least 500 fire incidents)
| Kenosha: | 4 minutes |
| Pleasant Prairie: | 5 minutes |
| Winthrop Harbor: | 5 minutes |
| Zion: | 5 minutes |
| Racine: | 5 minutes |
| Wadsworth: | 7 minutes |
| Beach Park: | 6 minutes |
| Union Grove: | 11 minutes |
| Antioch: | 8 minutes |
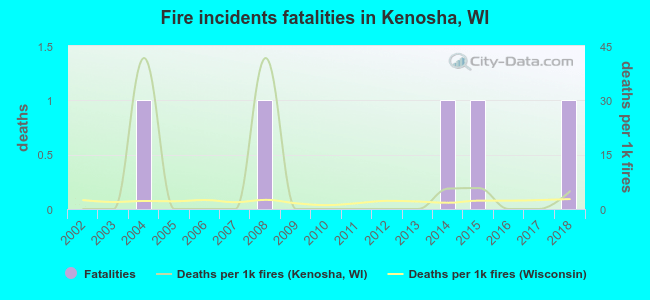 Based on the reports from the years 2002 - 2018 the average number of fire-related fatalities per year is 0. The highest number of deaths - 1 took place in 2004, and the lowest - 0 in 2002. The data has an increasing trend.
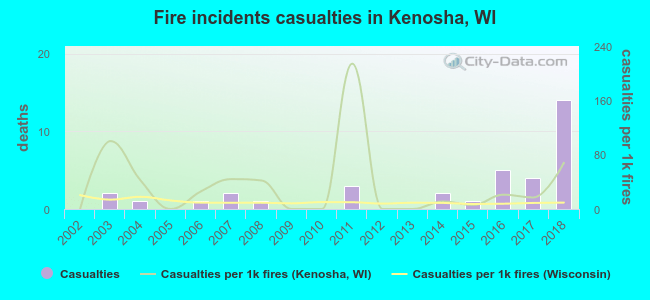 According to the reports from the years 2002 - 2018 the average number of fire-related yearly casualties is 2. The highest number of reported casualties - 14 took place in 2018, and the lowest - 0 in 2002. The data has a rising trend.
The average number of injuries per 1,000 fire incidents is 35. This indicator was the highest - 214 in 2011, and the lowest 0 in 2002. The trend for casualties per 1,000 fires is growing. Compared to the state value the number of casualties per 1,000 incidents is much higher.
According to the reports from the years 2002 - 2018 the average number of fire-related yearly casualties is 2. The highest number of reported casualties - 14 took place in 2018, and the lowest - 0 in 2002. The data has a rising trend.
The average number of injuries per 1,000 fire incidents is 35. This indicator was the highest - 214 in 2011, and the lowest 0 in 2002. The trend for casualties per 1,000 fires is growing. Compared to the state value the number of casualties per 1,000 incidents is much higher.Casualties per 1,000 incidents in Kenosha, WI compared to nearest cities:
(Note: Based on data for all years, including only cities with at least 500 fire incidents)
| Kenosha: | 26.3 |
| Pleasant Prairie: | 48.8 |
| Winthrop Harbor: | 15.2 |
| Zion: | 11.7 |
| Racine: | 13.2 |
| Wadsworth: | 5.1 |
| Beach Park: | 8.1 |
| Union Grove: | 5.1 |
| Antioch: | 7.2 |
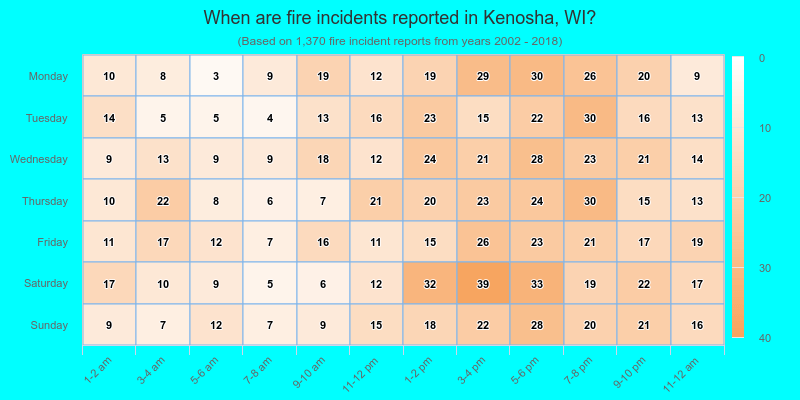
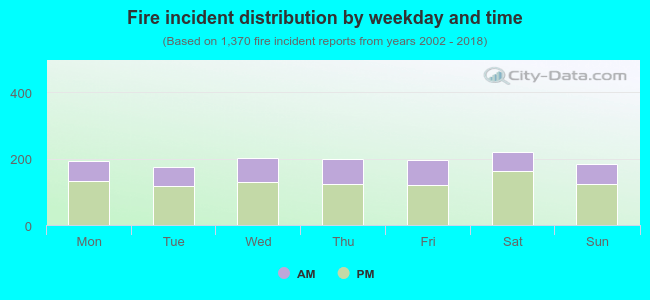 33.1% incidents where reported in the morning and 66.9% in the evening. The most fires (16.1%) took place on Saturday, and the least (12.8%) on Tuesday.
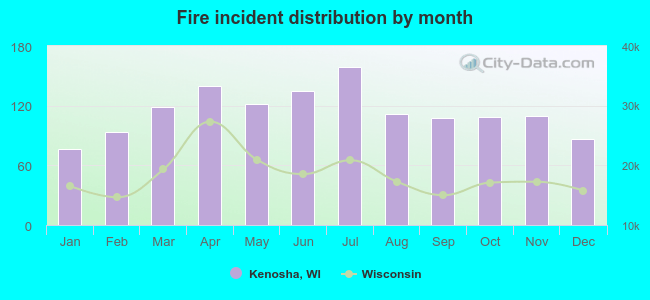 Based on the 1,370 reports from years 2002 - 2018 most fires (11.6%) took place during July, and the least (5.5%) in January.
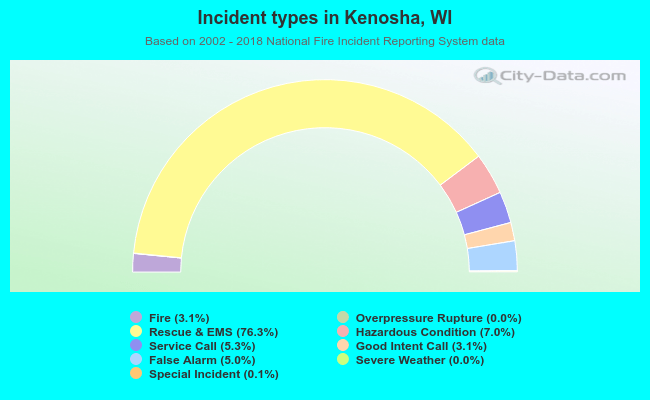 Out of all 43,974 cases reported during the years 2002 - 2018, the most belonged to the categories: Rescue & EMS (76.3%), Hazardous Condition (7.0%), and Service Call (5.3%).
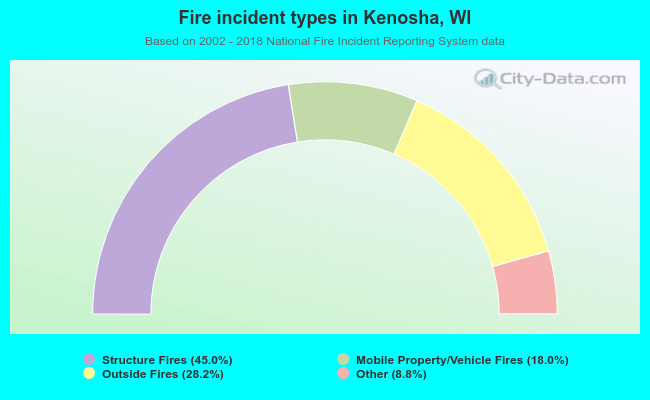 When looking into fire subcategories, the most reports belonged to: Structure Fires (45.0%), and Outside Fires (28.2%).