Kinnelon: Fire Incidents, New Jersey (NJ)
Where are fire incidents reported in Kinnelon, NJ
Something went wrong! Please refresh the page.
|
| |||||||||||||||||||||||||||||||||||||||||||||||||||||||||||||||||||||||||||||||||||||||||||||||||||||||||||||
2003 - 2018 National Fire Incident Reporting System (NFIRS) incidents
- Incident types reported to NFIRS in Kinnelon, NJ
- 53133.9%Fire
- 44828.6%Hazardous Condition
- 39825.4%False Alarm
- 815.2%Service Call
- 694.4%Good Intent Call
- 291.9%Rescue & EMS
- 50.3%Overpressure Rupture
- 40.3%Severe Weather
- Fire incident types reported to NFIRS in Kinnelon, NJ
- 35667.0%Structure Fires
- 12223.0%Outside Fires
- 478.9%Mobile Property/Vehicle Fires
- 61.1%Other
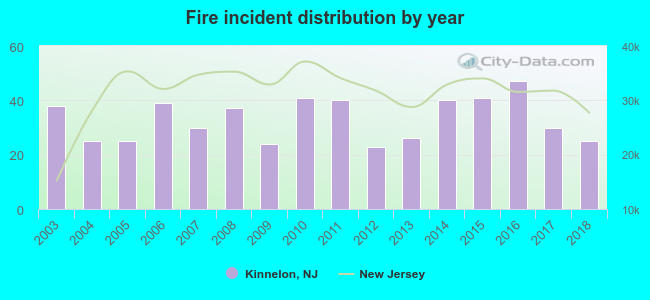 Based on the data from the years 2003 - 2018 the average number of fire incidents per year is 33. The highest number of fires - 47 took place in 2016, and the least - 23 in 2012. The data has a dropping trend.
The average number of yearly fire incidents per 10k residents in Kinnelon, NJ compared to nearest cities:
(Note: Based on data for the last 3 years, including only cities with population 5,000 and above)
| Kinnelon: | 32.8 |
| Butler: | 16.5 |
| Bloomingdale: | 25.3 |
| Pompton Lakes: | 14.9 |
| Wanaque: | 16.9 |
| Lincoln Park: | 7.6 |
| Boonton: | 25.8 |
| Wayne: | 12.5 |
| Oakland: | 19.9 |
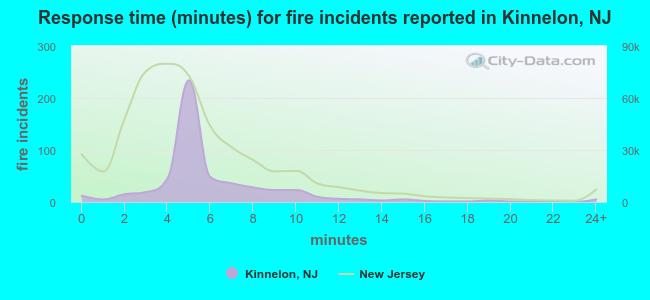 The median response time based on all reported fire incidents is 5 minutes. This is comparable to the state median value.
The median response time in Kinnelon, NJ compared to nearest cities:
(Note: Based on data for all years, including only cities with at least 500 fire incidents)
| Kinnelon: | 5 minutes |
| Wayne: | 5 minutes |
| Oakland: | 5 minutes |
| Fairfield: | 5 minutes |
| West Milford: | 6 minutes |
| Ringwood: | 3 minutes |
| Rockaway: | 8 minutes |
| Totowa: | 3 minutes |
| Wyckoff: | 5 minutes |
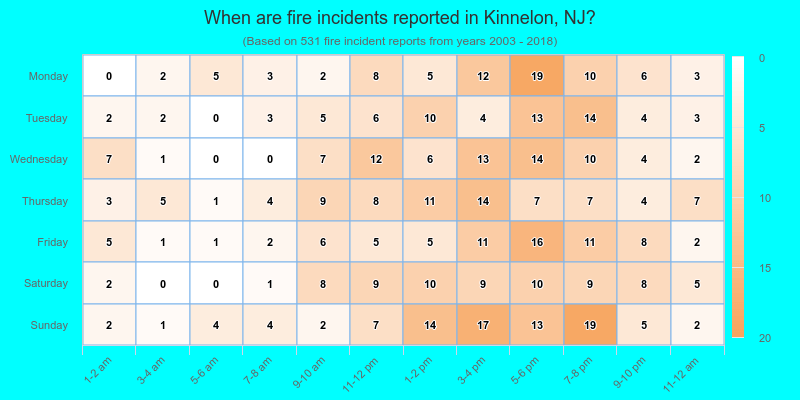
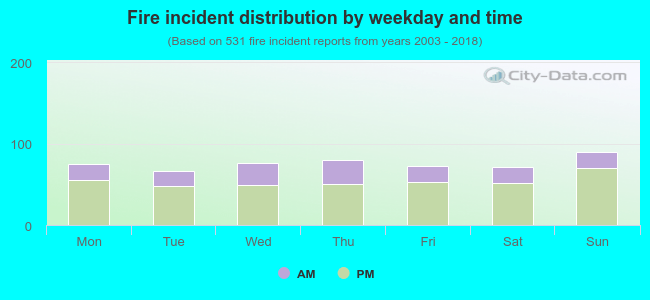 29.2% incidents where reported in the morning and 70.8% in the evening. The most fires (16.9%) took place on Sunday, and the least (12.4%) on Tuesday.
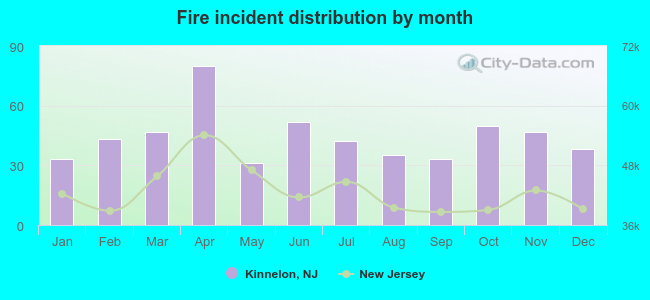 According to the 531 fire incident reports from years 2003 - 2018 most fires (15.1%) took place during April, and the least (5.8%) in May.
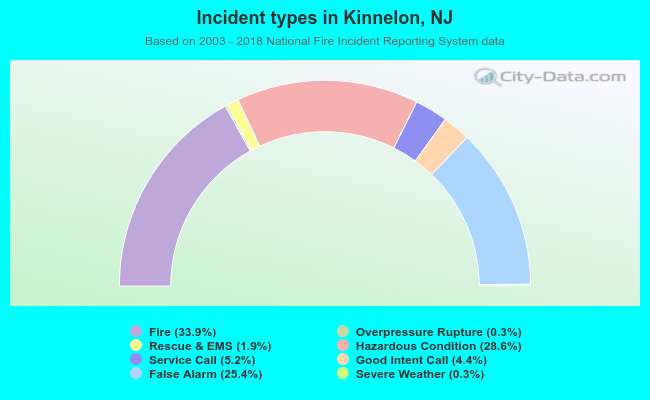 Out of all 1,565 cases reported during the years 2003 - 2018, the most belonged to the categories: Fire (33.9%), Hazardous Condition (28.6%), and False Alarm (25.4%).
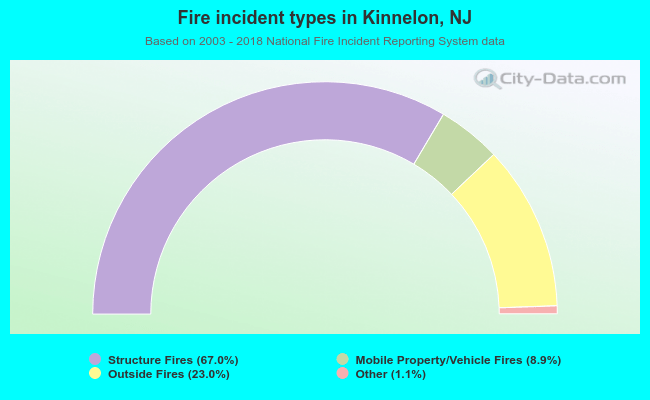 When looking into fire subcategories, the most incidents belonged to: Structure Fires (67.0%), and Outside Fires (23.0%).