Kinston: Fire Incidents, North Carolina (NC)
Where are fire incidents reported in Kinston, NC
Something went wrong! Please refresh the page.
| Fire incidents reported | |
|---|---|
| Sreet name | Count |
| QUEEN ST | 222 |
| BRIGHT ST | 180 |
| VERNON AVE | 176 |
| WASHINGTON AVE | 126 |
| PEYTON AVE | 110 |
| HERRITAGE ST | 80 |
| 58 HWY | 78 |
| 258 HWY | 66 |
| CAREY RD | 66 |
| CASWELL ST | 64 |
| NEUSE RD | 64 |
| NEW BERN RD | 58 |
| COBB RD | 54 |
| GORDON ST | 50 |
| HIGHLAND AVE | 50 |
| LENOIR AVE | 50 |
| TOWER HILL RD | 50 |
| 70 HWY | 46 |
| SHINE ST | 44 |
| AIRPORT RD | 40 |
| CHESTNUT ST | 38 |
| HARDEE RD | 38 |
| ADKIN ST | 34 |
| KING ST | 32 |
| OLD SNOW HILL RD | 32 |
| BLOUNT ST | 30 |
| COLLIER LOFTIN RD | 30 |
| LINCOLN ST | 30 |
| MARILYN DR | 30 |
| SUMMIT AVE | 30 |
| Other | 1,062 |
2002 - 2018 National Fire Incident Reporting System (NFIRS) incidents
- Incident types reported to NFIRS in Kinston, NC
- 7,80644.9%Rescue & EMS
- 3,06017.6%Fire
- 2,69915.5%Hazardous Condition
- 1,92511.1%False Alarm
- 1,3898.0%Good Intent Call
- 4582.6%Service Call
- 350.2%Overpressure Rupture
- 210.1%Severe Weather
- Fire incident types reported to NFIRS in Kinston, NC
- 1,70855.8%Structure Fires
- 87528.6%Outside Fires
- 39713.0%Mobile Property/Vehicle Fires
- 802.6%Other
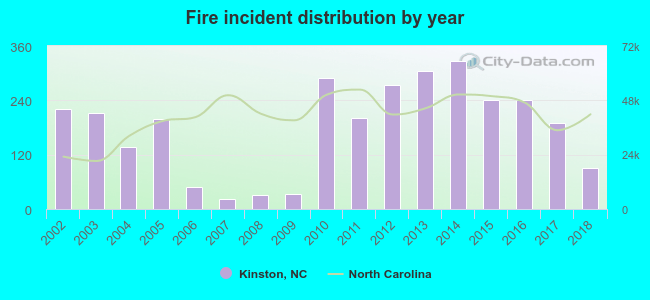 According to the data from the years 2002 - 2018 the average number of fire incidents per year is 180. The highest number of fires - 326 took place in 2014, and the least - 23 in 2007. The data has a declining trend.
The average number of yearly fire incidents per 10k residents in Kinston, NC compared to nearest cities:
(Note: Based on data for the last 3 years, including only cities with population 5,000 and above)
| Kinston: | 81.3 |
| Ayden: | 102.1 |
| Winterville: | 89.7 |
| Goldsboro: | 99.6 |
| Greenville: | 51.0 |
| New Bern: | 57.9 |
| Half Moon: | 4.4 |
| James City: | 11.0 |
| Washington: | 112.4 |
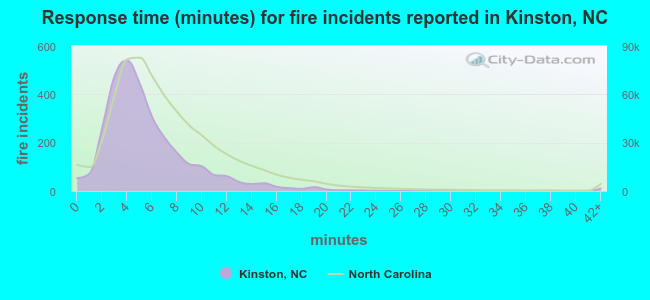 The median response time based on all reported fire incidents is 5 minutes. This is lower than the state median value.
The median response time in Kinston, NC compared to nearest cities:
(Note: Based on data for all years, including only cities with at least 500 fire incidents)
| Kinston: | 5 minutes |
| Grifton: | 8 minutes |
| La Grange: | 7 minutes |
| Snow Hill: | 8 minutes |
| Ayden: | 5 minutes |
| Trenton: | 10 minutes |
| Winterville: | 7 minutes |
| Farmville: | 7 minutes |
| Goldsboro: | 6 minutes |
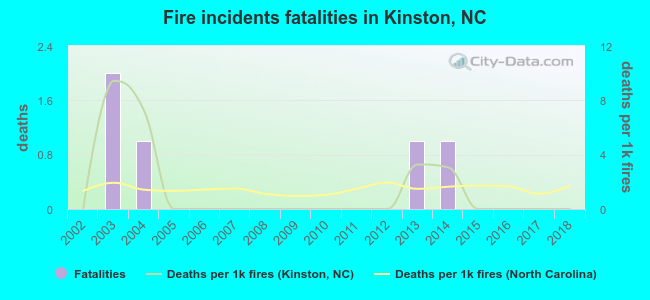 Based on the reports from the years 2002 - 2018 the average number of fire-related fatalities per year is 0. The highest number of reported deaths - 2 took place in 2003, and the lowest - 0 in 2002. The data has a constant trend.
The average number of deaths per 1,000 fires is 1. This indicator was the highest - 9 in 2003, and the lowest 0 in 2002. The trend for fatalities per 1,000 fire incidents is constant. Compared to the North Carolina value the number of deaths per 1,000 incidents is about the same.
Based on the reports from the years 2002 - 2018 the average number of fire-related fatalities per year is 0. The highest number of reported deaths - 2 took place in 2003, and the lowest - 0 in 2002. The data has a constant trend.
The average number of deaths per 1,000 fires is 1. This indicator was the highest - 9 in 2003, and the lowest 0 in 2002. The trend for fatalities per 1,000 fire incidents is constant. Compared to the North Carolina value the number of deaths per 1,000 incidents is about the same.Deaths per 1,000 incidents in Kinston, NC compared to nearest cities:
(Note: Based on data for all years, including only cities with at least 2,500 fire incidents)
| Kinston: | 1.6 |
| Goldsboro: | 2.0 |
| Greenville: | 1.8 |
| New Bern: | 1.7 |
| Jacksonville: | 1.1 |
| Wilson: | 1.9 |
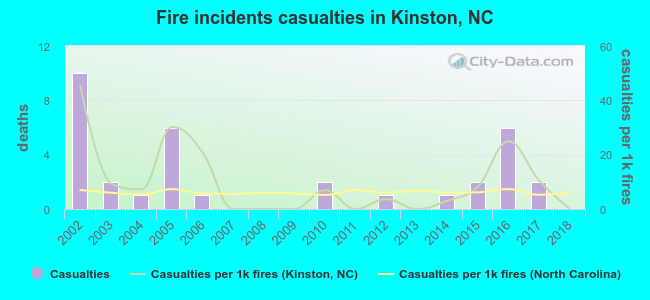 Based on the reports from the years 2002 - 2018 the average number of fire-related yearly casualties is 2. The highest number of reported injuries - 10 took place in 2002, and the lowest - 0 in 2007. The data has a dropping trend.
The average number of injuries per 1,000 fire incidents is 10. This indicator was the highest - 45 in 2002, and the lowest 0 in 2007. The trend for injuries per 1,000 incidents is decreasing. Compared to the state value the number of injuries per 1,000 incidents is higher.
Based on the reports from the years 2002 - 2018 the average number of fire-related yearly casualties is 2. The highest number of reported injuries - 10 took place in 2002, and the lowest - 0 in 2007. The data has a dropping trend.
The average number of injuries per 1,000 fire incidents is 10. This indicator was the highest - 45 in 2002, and the lowest 0 in 2007. The trend for injuries per 1,000 incidents is decreasing. Compared to the state value the number of injuries per 1,000 incidents is higher.
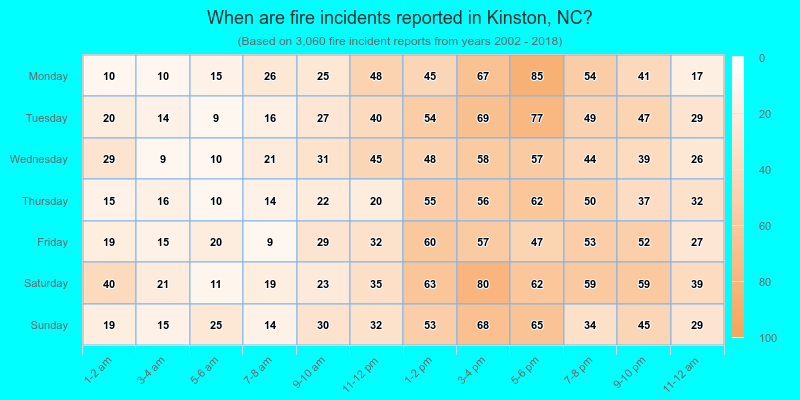
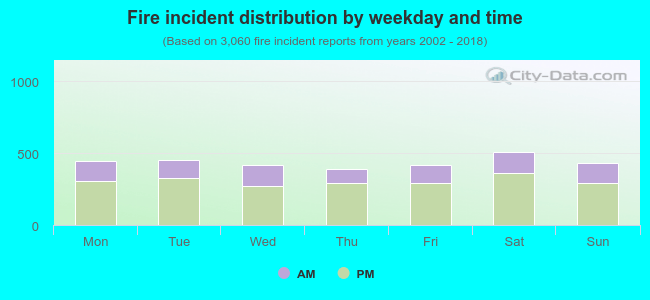 29.7% incidents where reported in the morning and 70.3% in the evening. The most fires (16.7%) took place on Saturday, and the least (12.7%) on Thursday.
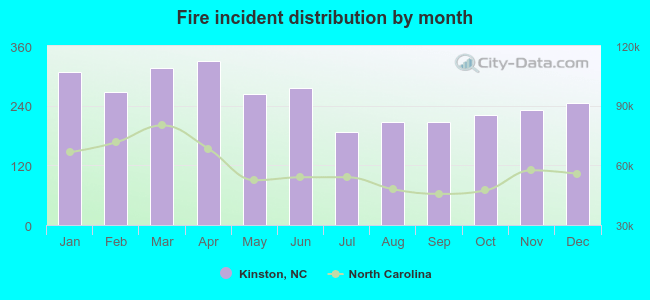 Based on the 3,060 fires from years 2002 - 2018 most fires (10.8%) took place during April, and the least (6.1%) in July.
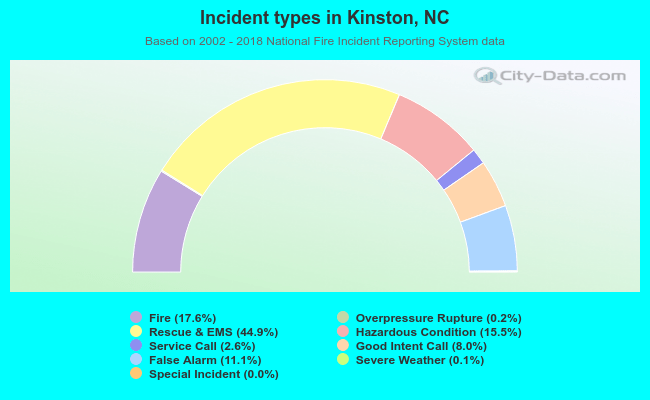 Out of all 17,397 cases reported during the years 2002 - 2018, the most belonged to the categories: Rescue & EMS (44.9%), Fire (17.6%), and Hazardous Condition (15.5%).
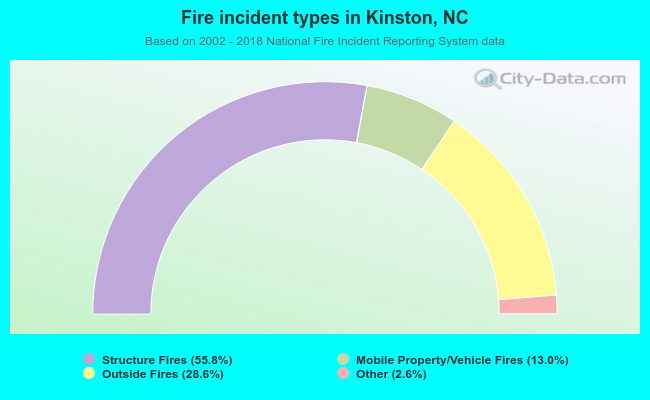 When looking into fire subcategories, the most incidents belonged to: Structure Fires (55.8%), and Outside Fires (28.6%).