La Salle: Fire Incidents, Colorado (CO)
Where are fire incidents reported in La Salle, CO
Something went wrong! Please refresh the page.
|
| |||||||||||||||||||||||||||||||||||||||||||||||||||||||||||||||||||||||||||||||||||||||||||||||||||||||||||||
2003 - 2018 National Fire Incident Reporting System (NFIRS) incidents
- Incident types reported to NFIRS in La Salle, CO
- 49045.1%Rescue & EMS
- 21720.0%Good Intent Call
- 20619.0%Fire
- 676.2%False Alarm
- 434.0%Hazardous Condition
- 434.0%Service Call
- 90.8%Special Incident
- 60.6%Overpressure Rupture
- 60.6%Severe Weather
- Fire incident types reported to NFIRS in La Salle, CO
- 10952.9%Outside Fires
- 6732.5%Structure Fires
- 167.8%Mobile Property/Vehicle Fires
- 146.8%Other
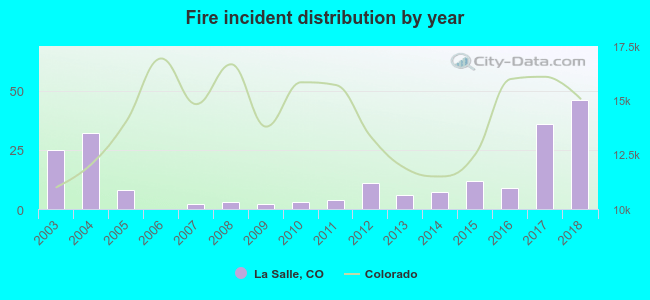 According to the data from the years 2003 - 2018 the average number of fires per year is 13. The highest number of reported fires - 46 took place in 2018, and the least - 0 in 2006. The data has a rising trend.
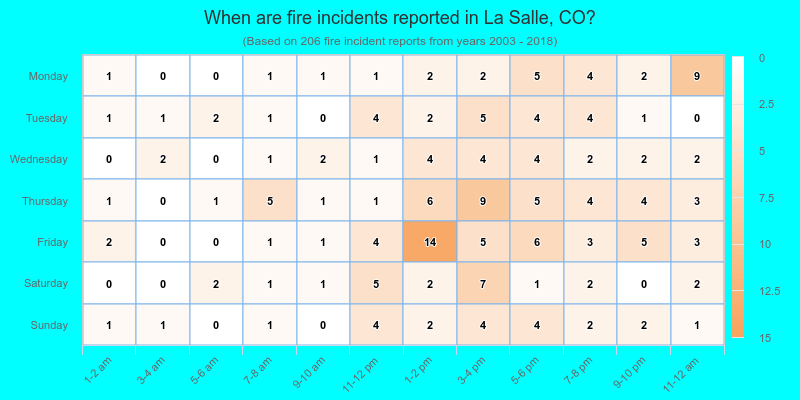
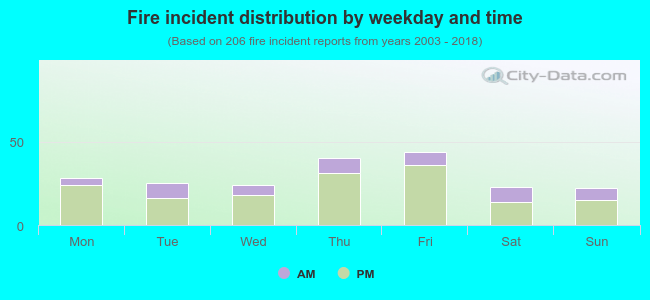 25.2% incidents where reported in the morning and 74.8% in the evening. The most fires (21.4%) took place on Friday, and the least (10.7%) on Sunday.
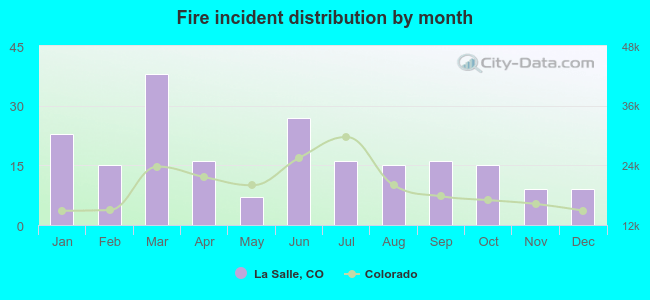 Based on the 206 fires from years 2003 - 2018 most fires (18.4%) took place during March, and the least (3.4%) in May.
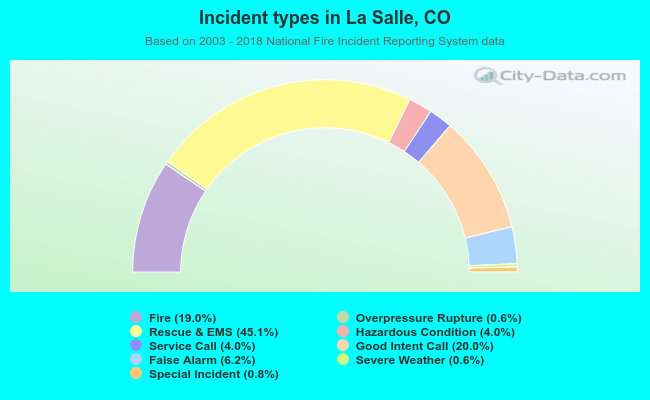 Out of all 1,087 cases reported during the years 2003 - 2018, the most belonged to the categories: Rescue & EMS (45.1%), Good Intent Call (20.0%), and Fire (19.0%).
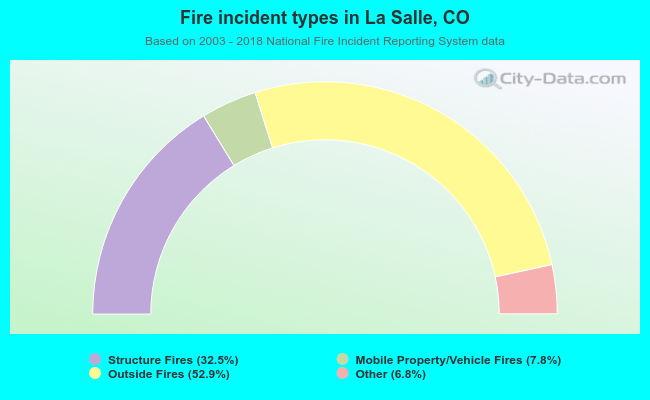 When looking into fire subcategories, the most reports belonged to: Outside Fires (52.9%), and Structure Fires (32.5%).