La Union: Fire Incidents, New Mexico (NM)
Where are fire incidents reported in La Union, NM
Something went wrong! Please refresh the page.
|
| |||||||||||||||||||||||||||||||||||||||||||||||||||||||||||||||||||||||||||||||||||||||||||||||||||||||||||||
2010 - 2018 National Fire Incident Reporting System (NFIRS) incidents
- Incident types reported to NFIRS in La Union, NM
- 24138.4%Rescue & EMS
- 19230.6%Good Intent Call
- 13321.2%Fire
- 365.7%Service Call
- 182.9%Hazardous Condition
- 61.0%False Alarm
- 10.2%Severe Weather
- 10.2%Special Incident
- Fire incident types reported to NFIRS in La Union, NM
- 7657.1%Outside Fires
- 3526.3%Structure Fires
- 1410.5%Other
- 86.0%Mobile Property/Vehicle Fires
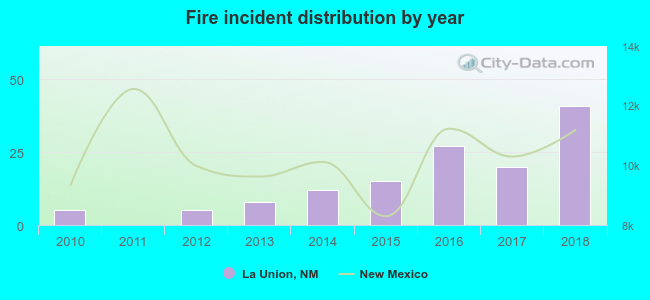 Based on the data from the years 2010 - 2018 the average number of fires per year is 15. The highest number of fire incidents - 41 took place in 2018, and the least - 0 in 2011. The data has a growing trend.
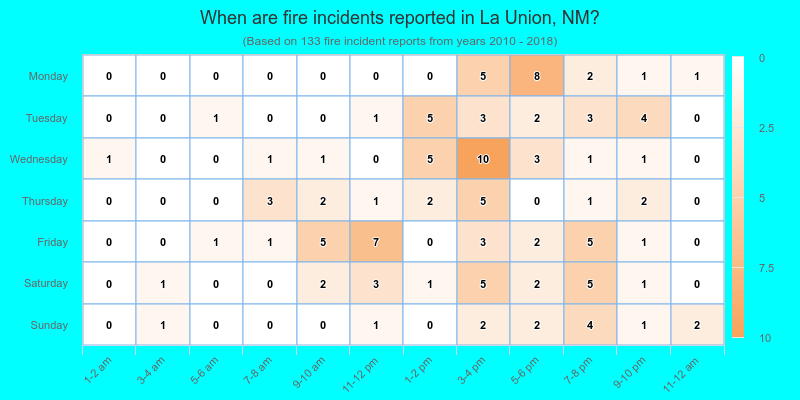
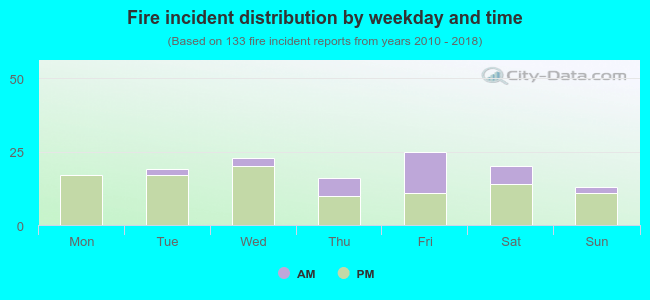 24.8% incidents where reported in the morning and 75.2% in the evening. The most fires (18.8%) took place on Friday, and the least (9.8%) on Sunday.
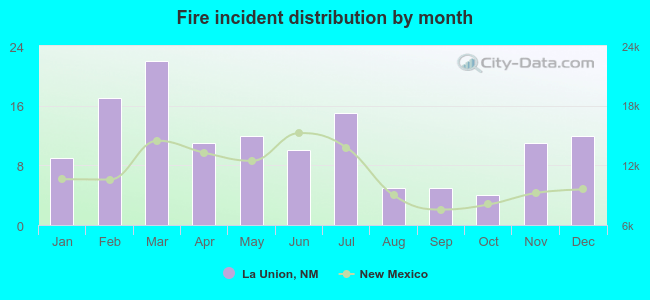 Based on the 133 reports from years 2010 - 2018 most fires (16.5%) took place during March, and the least (3.0%) in October.
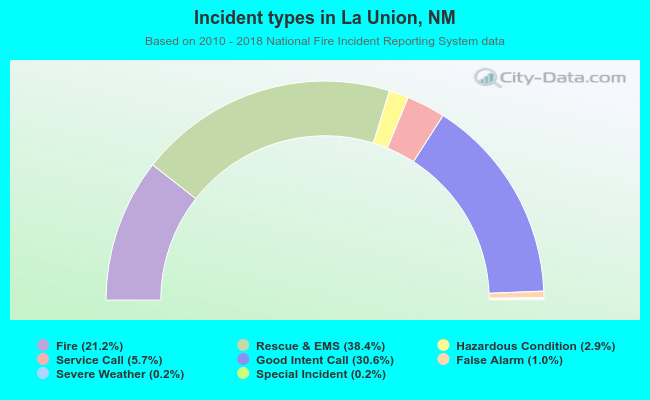 Out of all 628 cases reported during the years 2010 - 2018, the most belonged to the categories: Overpressure Rupture (38.4%), Service Call (30.6%), and Fire (21.2%).
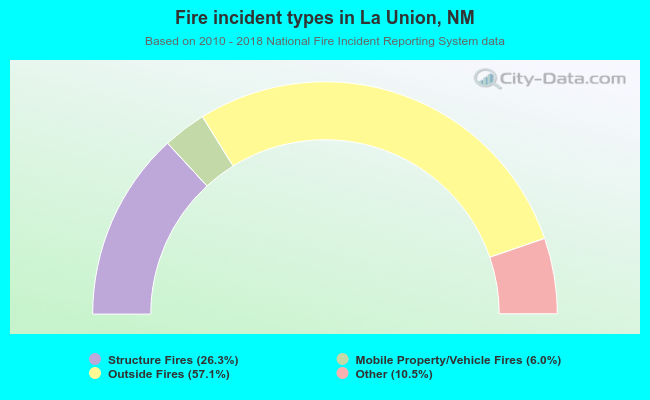 When looking into fire subcategories, the most reports belonged to: Outside Fires (57.1%), and Structure Fires (26.3%).