Lakeport: Fire Incidents, California (CA)
Where are fire incidents reported in Lakeport, CA
Something went wrong! Please refresh the page.
|
| |||||||||||||||||||||||||||||||||||||||||||||||||||||||||||||||||||||||||||||||||||||||||||||||||||||||||||||
2005 - 2018 National Fire Incident Reporting System (NFIRS) incidents
- Incident types reported to NFIRS in Lakeport, CA
- 40843.5%Fire
- 28730.6%Rescue & EMS
- 11612.4%Good Intent Call
- 10711.4%Hazardous Condition
- 141.5%Service Call
- 40.4%False Alarm
- 20.2%Special Incident
- Fire incident types reported to NFIRS in Lakeport, CA
- 24259.3%Outside Fires
- 10826.5%Structure Fires
- 317.6%Mobile Property/Vehicle Fires
- 276.6%Other
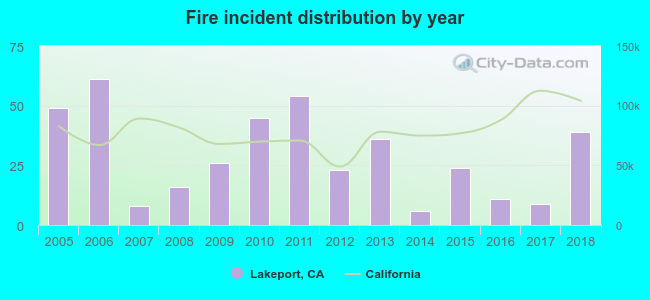 According to the data from the years 2005 - 2018 the average number of fires per year is 29. The highest number of fire incidents - 61 took place in 2006, and the least - 6 in 2014. The data has a declining trend.
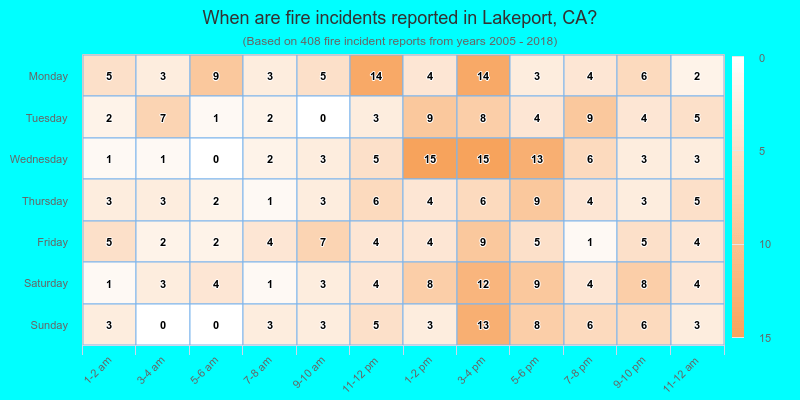
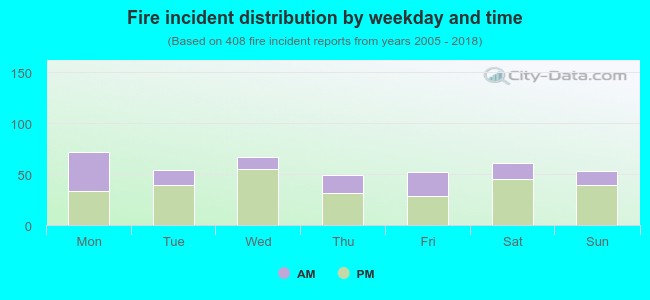 33.8% incidents where reported in the morning and 66.2% in the evening. The most fires (17.6%) took place on Monday, and the least (12.0%) on Thursday.
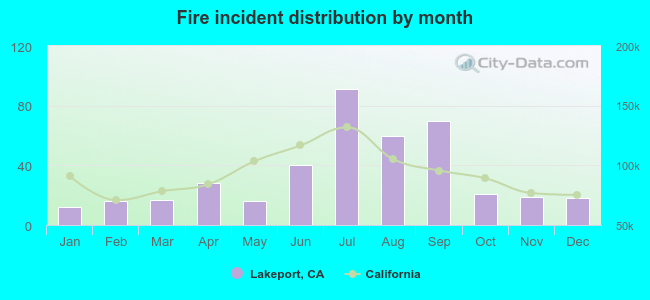 Based on the 408 fire incidents from years 2005 - 2018 most fires (22.3%) took place during July, and the least (2.9%) in January.
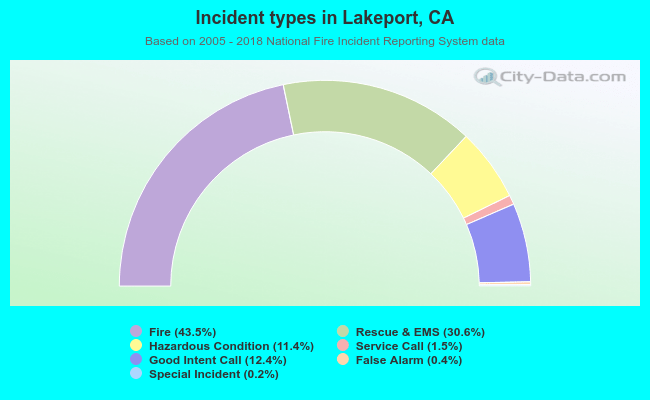 Out of all 938 cases reported during the years 2005 - 2018, the most belonged to the categories: Fire (43.5%), Overpressure Rupture (30.6%), and Service Call (12.4%).
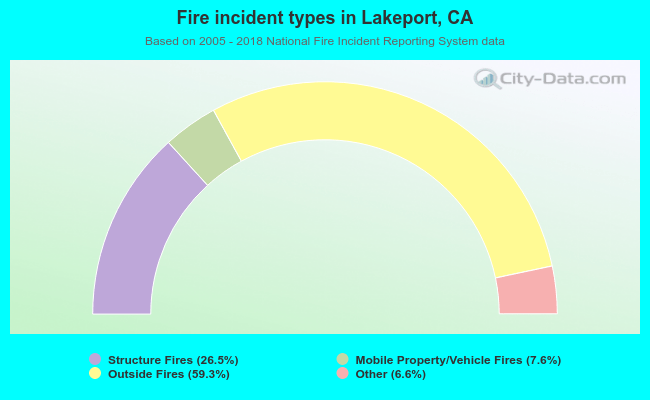 When looking into fire subcategories, the most incidents belonged to: Outside Fires (59.3%), and Structure Fires (26.5%).