Lead: Fire Incidents, South Dakota (SD)
Where are fire incidents reported in Lead, SD
Something went wrong! Please refresh the page.
|
| |||||||||||||||||||||||||||||||||||||||||||||||||||||||||||||||||||||||||||||||||||||||||||||||||||||||||||||
| Other | 3 | |||||||||||||||||||||||||||||||||||||||||||||||||||||||||||||||||||||||||||||||||||||||||||||||||||||||||||||
2002 - 2018 National Fire Incident Reporting System (NFIRS) incidents
- Incident types reported to NFIRS in Lead, SD
- 19943.5%Rescue & EMS
- 12527.4%Fire
- 5411.8%Hazardous Condition
- 255.5%Good Intent Call
- 255.5%False Alarm
- 224.8%Service Call
- 51.1%Severe Weather
- 10.2%Overpressure Rupture
- 10.2%Special Incident
- Fire incident types reported to NFIRS in Lead, SD
- 6753.6%Outside Fires
- 5140.8%Structure Fires
- 43.2%Other
- 32.4%Mobile Property/Vehicle Fires
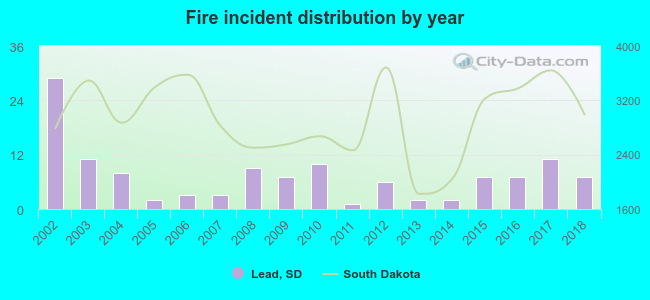 Based on the data from the years 2002 - 2018 the average number of fire incidents per year is 7. The highest number of reported fire incidents - 29 took place in 2002, and the least - 1 in 2011. The data has a decreasing trend.
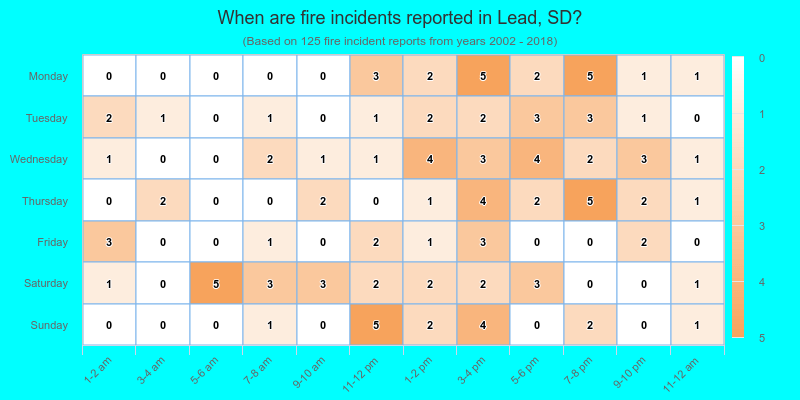
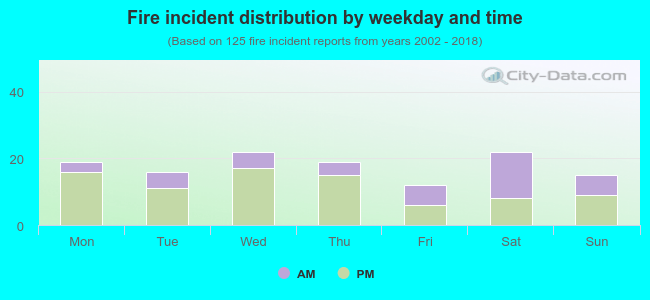 34.4% incidents where reported in the morning and 65.6% in the evening. The most fires (17.6%) took place on Wednesday, and the least (9.6%) on Friday.
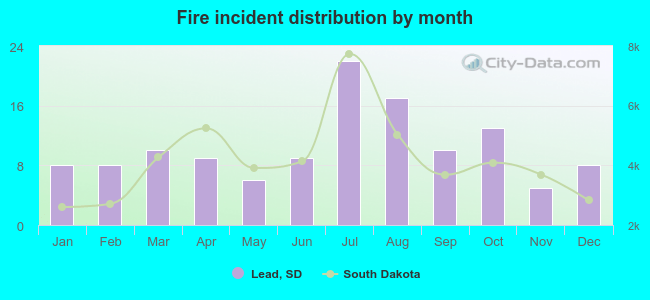 According to the 125 fires from years 2002 - 2018 most fires (17.6%) took place during July, and the least (4.0%) in November.
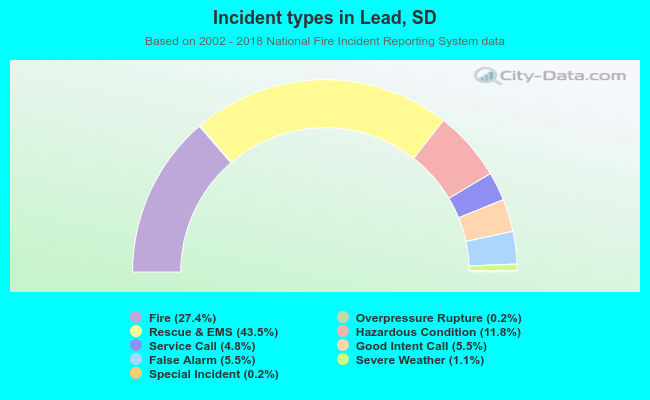 Out of all 457 cases reported during the years 2002 - 2018, the most belonged to the categories: Rescue & EMS (43.5%), Fire (27.4%), and Hazardous Condition (11.8%).
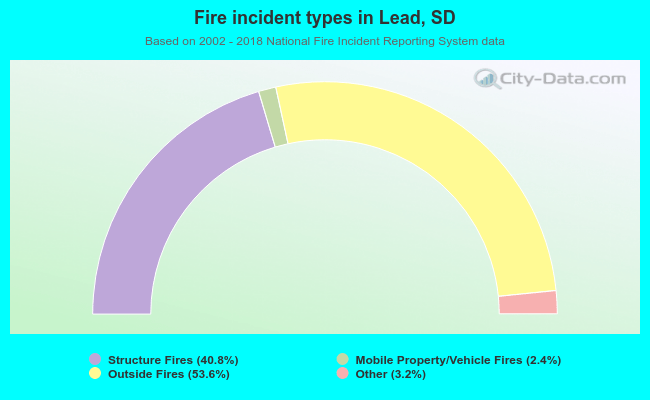 When looking into fire subcategories, the most incidents belonged to: Outside Fires (53.6%), and Structure Fires (40.8%).